In the context of System and Application Log Monitoring, Nagios is used to track and alert on log files that are generated by both the operating system and applications. This helps administrators quickly identify issues and anomalies based on the log data.
Who is it for?
In short, log monitoring is for everyone responsible for maintaining, securing, or optimizing the systems and applications that support an organization’s operations. It’s a cross-functional activity that can help all teams detect issues quickly, ensure compliance, and keep systems running smoothly.
Summary of Who Benefits from Log Monitoring:
System Administrators: Monitor system health and diagnose failures.
DevOps Engineers: Detect and resolve performance issues in production.
Security Engineers: Identify security breaches or unauthorized access.
Application Developers: Troubleshoot and optimize application performance.
Site Reliability Engineers: Ensure system uptime and reliability.
IT Operations: Maintain day-to-day system health and availability.
Network Engineers: Ensure network infrastructure is performing optimally.
Database Administrators: Monitor database performance and integrity.
Compliance Teams: Maintain audit trails for compliance and regulations.
Business Leaders: Get insights into IT performance aligned with business goals.
Cloud Engineers: Manage and optimize cloud-based environments.
How Nagios Log Monitoring Works
Nagios itself doesn’t directly handle logs in the same way as dedicated log aggregation tools (like ELK or Splunk), but it can monitor log files through plugins and integrations. It typically works as follows:
Log File Monitoring: Nagios can be configured to monitor specific log files on system or application servers, looking for certain patterns or events that could indicate issues or critical errors.
For example, Nagios might watch system logs like /var/log/syslog (Linux) or event logs (Windows) or monitor specific application log files such as /var/log/apache2/error.log.
Plugins: Nagios uses various plugins to monitor logs. The most commonly used plugin for log file monitoring is the check_log plugin, which allows Nagios to search for specific keywords, phrases, or error codes within log files.
check_log: A plugin that searches for specific strings in log files (like “error”, “fail”, or other custom strings) and alerts the Nagios system when these strings appear.
Custom scripts can also be written to monitor logs based on more complex patterns or criteria.
Thresholds & Alerts: You can configure Nagios to trigger an alert when certain conditions are met within the logs. This can include:
The presence of specific error messages or warning patterns.
The number of times a certain event occurs within a set time frame.
Matching patterns that could indicate critical issues or security breaches.
These thresholds help Nagios notify administrators or teams when issues need immediate attention.
Centralized Monitoring: Nagios provides a centralized dashboard where log data, along with system and application metrics, can be displayed in a unified interface. From there, you can:
View alerts triggered by log file events.
Investigate historical log data for patterns.
Integrate log monitoring with other Nagios metrics for comprehensive system health checks.
Types of Logs Monitored in Nagios
System Logs: Logs generated by the operating system, such as syslog or kernel logs.
For example, /var/log/syslog on Linux or Event Viewer logs on Windows.
Application Logs: Logs generated by applications or services running on the system.
Examples include web server logs (e.g., Apache, Nginx), database logs (e.g., MySQL), and custom application logs.
Security Logs: Logs related to security events such as failed login attempts or system access events.
For example, /var/log/auth.log on Linux.
Setting Up Nagios for Log Monitoring
To set up Nagios to monitor system and application logs, you’ll typically need to:
Install Nagios Core: Set up Nagios on a server that will be used to monitor other systems (clients).
Install Required Plugins: Nagios requires plugins to monitor various system and application metrics. For log monitoring, install plugins like check_log or any custom script.
Configure Nagios to Monitor Logs:
Define a service check for monitoring specific log files. This will involve configuring the plugin to check for error patterns or other critical events in your log files.
For example, you might configure Nagios to check the Apache error log for entries containing the word “fatal” or “crash” to get alerted about critical web server issues.
Set Thresholds: Define conditions or thresholds for alerting, such as:
Alert when a “fatal” error is found.
Trigger an alert if more than X occurrences of a specific error message are found within Y minutes.
Configure Alerts: Set up notifications to inform the relevant team members via email, SMS, or other communication channels when a log-based event is triggered.
Key Features for Log Monitoring in Nagios
Customizability: With Nagios, you can create custom checks to monitor logs specific to your environment and business needs.
Threshold-based alerts: You can define different severity levels for different types of log events, ensuring the appropriate team is alerted to critical issues immediately.
Integration: Nagios can be integrated with other tools for better log management and analysis, such as using Nagios alongside centralized log management systems (e.g., ELK Stack, Splunk).
Visualization: Through Nagios XI (the paid version), users get access to more advanced visualizations and reporting features, which may include log data or event alerts.
Advantages of Using Nagios for Log Monitoring
Proactive Issue Detection: By monitoring logs in real-time, Nagios helps you identify problems before they escalate into full-blown system failures.
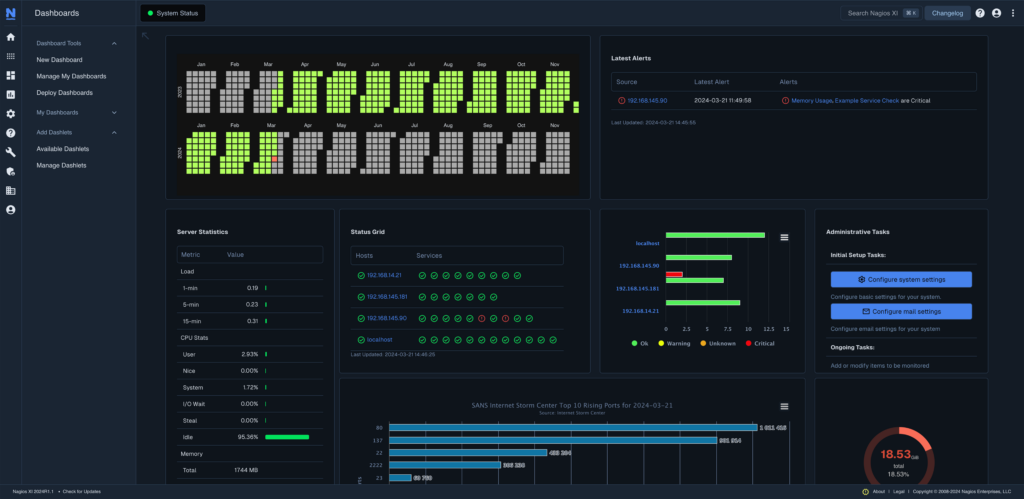
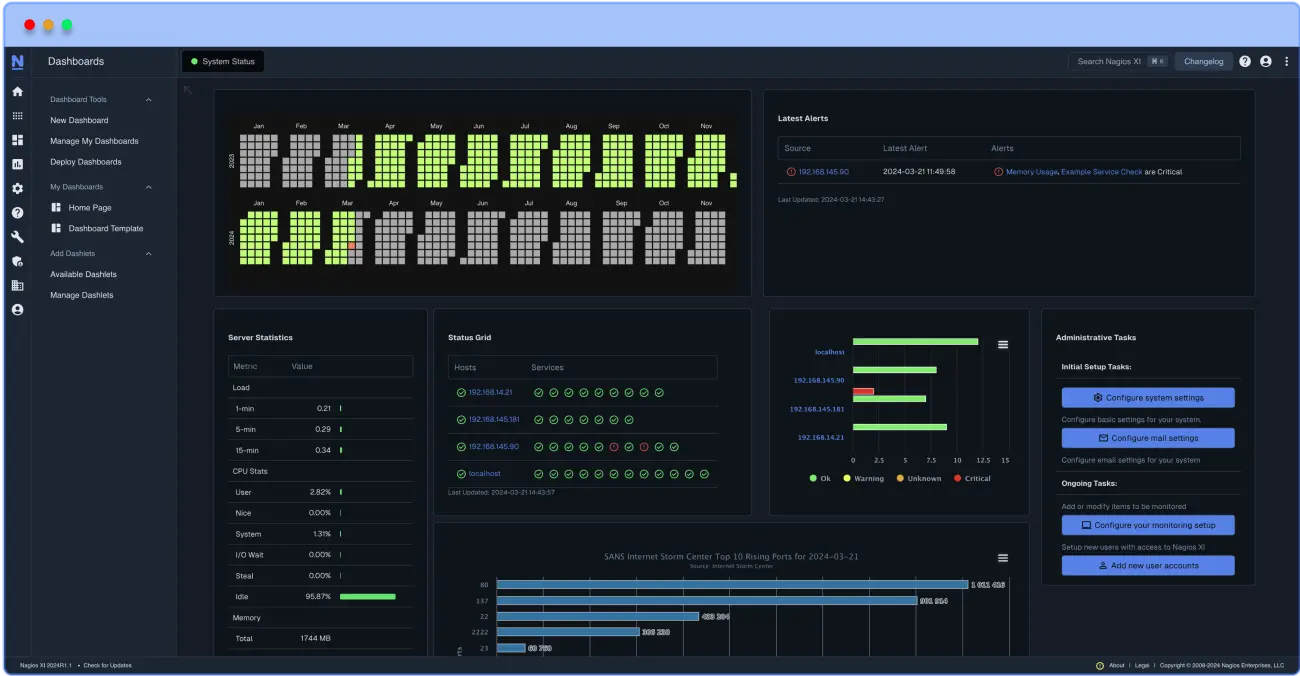
Centralized Monitoring: Nagios allows system administrators to manage not only hardware and network performance but also software behavior, all from a single dashboard.
Open Source & Extensible: As an open-source solution, Nagios offers a high level of flexibility and customization. It supports numerous plugins and can be extended to monitor almost any type of data source.
Scalability: Nagios is well-suited for large and complex environments, including distributed systems and multi-server architectures.
Limitations of Using Nagios for Log Monitoring
Basic Log Monitoring: Nagios is not primarily a log management tool, and its capabilities for deep log analysis (e.g., full-text search, visualizations, and long-term storage) are more limited compared to specialized tools like ELK Stack or Splunk.
Configuration Complexity: Setting up custom log monitoring and alerting can require a bit of technical knowledge, especially when working with regular expressions or complex scripts.
Capabilities
Nagios provides complete monitoring of system and application logs, log files, event logs, service logs, and system logs on Windows servers, Linux servers, and Unix servers. Nagios is capable of monitoring application logs, system logs, log files, and syslog data and alerting you when a log pattern is detected.
Benefits
Implementing effective system and application log monitoring with Nagios offers the following benefits:
Increased security
Increased awareness of network infrastructure problems
Increased server, service, and application availability
Fast detection of network outages and protocol failures
Fast detection of failed processes, services, cron jobs, and batch jobs
To learn more check out out our YouTube page and start monitoring today: