Nagios provides comprehensive monitoring of your IBM i servers, including metrics like CPU and disk utilization, ASP usage, number of active jobs, and long-running SQL jobs, plus much more. The official IBM i Nagios SQL plugin, SNMP, and JTOpen all support these services.
Nagios + IBM i provides administrators and operators with a centralized view of all IT assets in addition to the core IBM i metrics. You will also be able to graph and report on historical performance and have the flexibility to configure thresholds to your liking, not to mention the capability to create your own custom plugins.
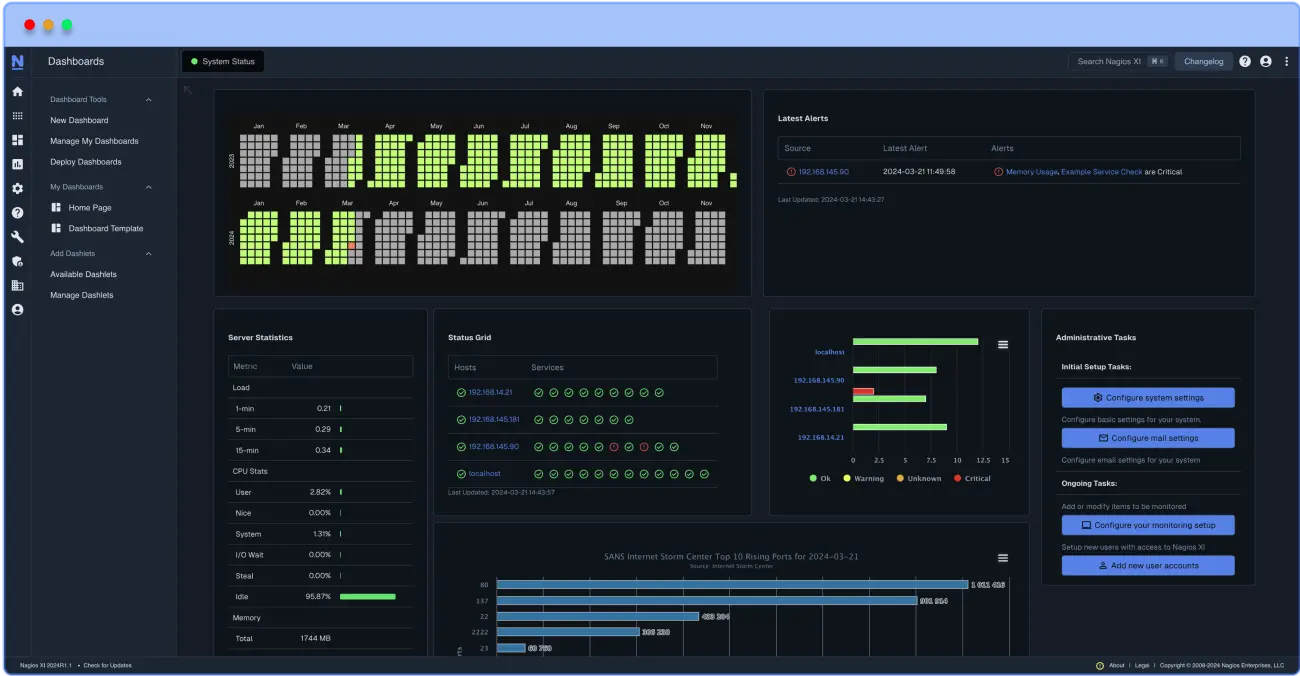
Nagios is a powerful network monitoring tool that gives you the freedom you need to manage everything on your network.
Implementing effective IBM i monitoring with Nagios offers the following benefits:
Reduce downtime and boost efficiency with proactive monitoring to ensure your systems run smoothly.