Logstash monitoring involves tracking the performance and health of the Logstash pipeline to ensure data processing is efficient and reliable. It includes monitoring metrics such as event throughput, CPU and memory usage, pipeline performance, and error rates. By integrating Logstash with monitoring tools like Nagios, administrators can set real-time alerts for issues such as high event latency, resource exhaustion, or pipeline failures, enabling proactive management and minimizing disruptions in log data processing.
Nagios provides comprehensive monitoring for Logstash by tracking event throughput, CPU and memory usage, pipeline health, error rates, and Logstash logs. It helps ensure efficient log processing by monitoring event rates and resource utilization, detecting potential bottlenecks or failures in the pipeline. Additionally, Nagios tracks errors and warnings within the logs, providing valuable insights for troubleshooting and ensuring smooth, uninterrupted log data flow.
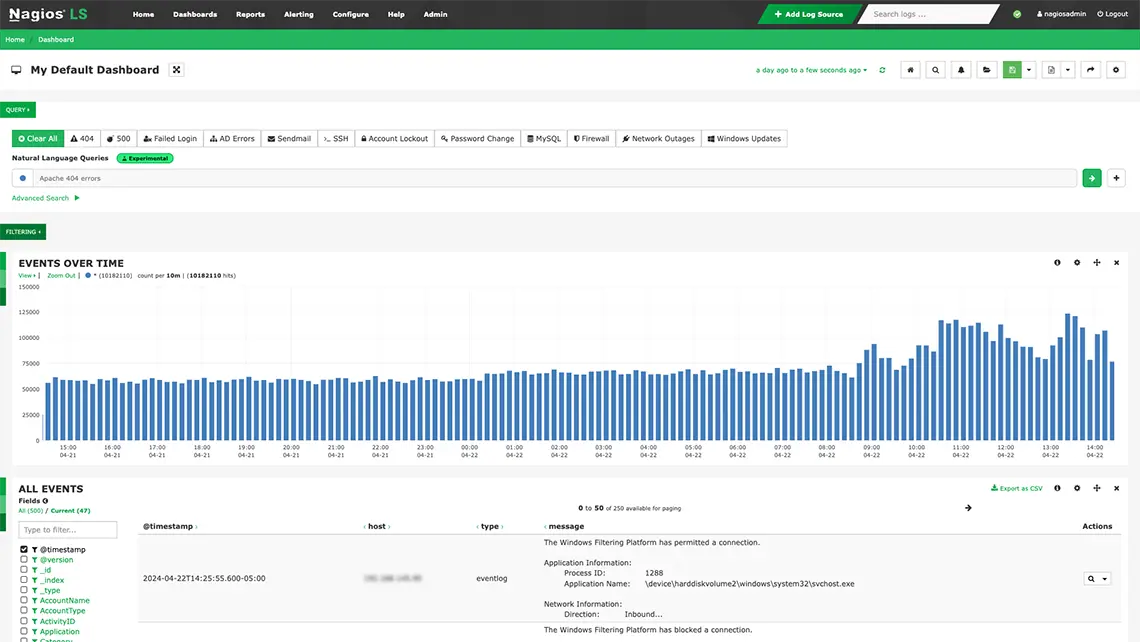
Simplify log monitoring with log data management, data analysis, and network security capabilities.