
 Nagios Fusion
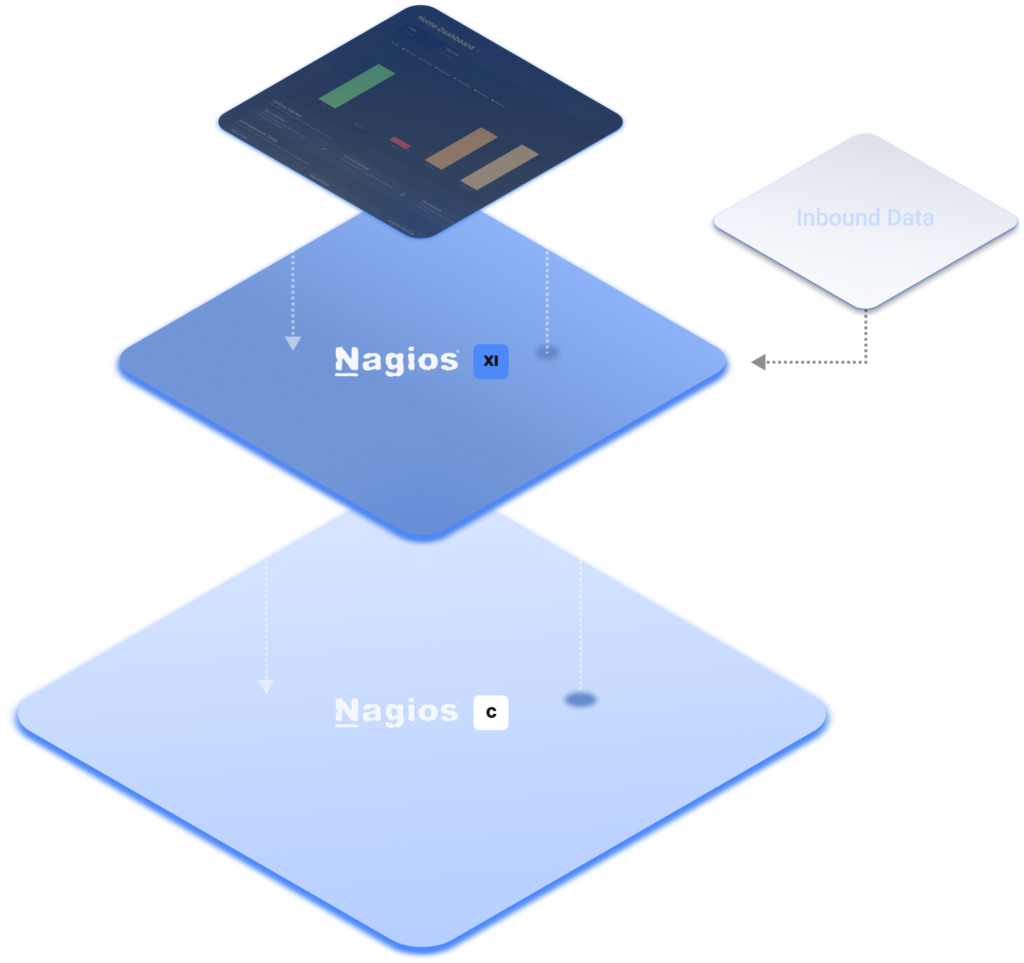
Nagios XI uses the powerful Nagios Core 4 monitoring engine to provide users with efficient, scalable monitoring.
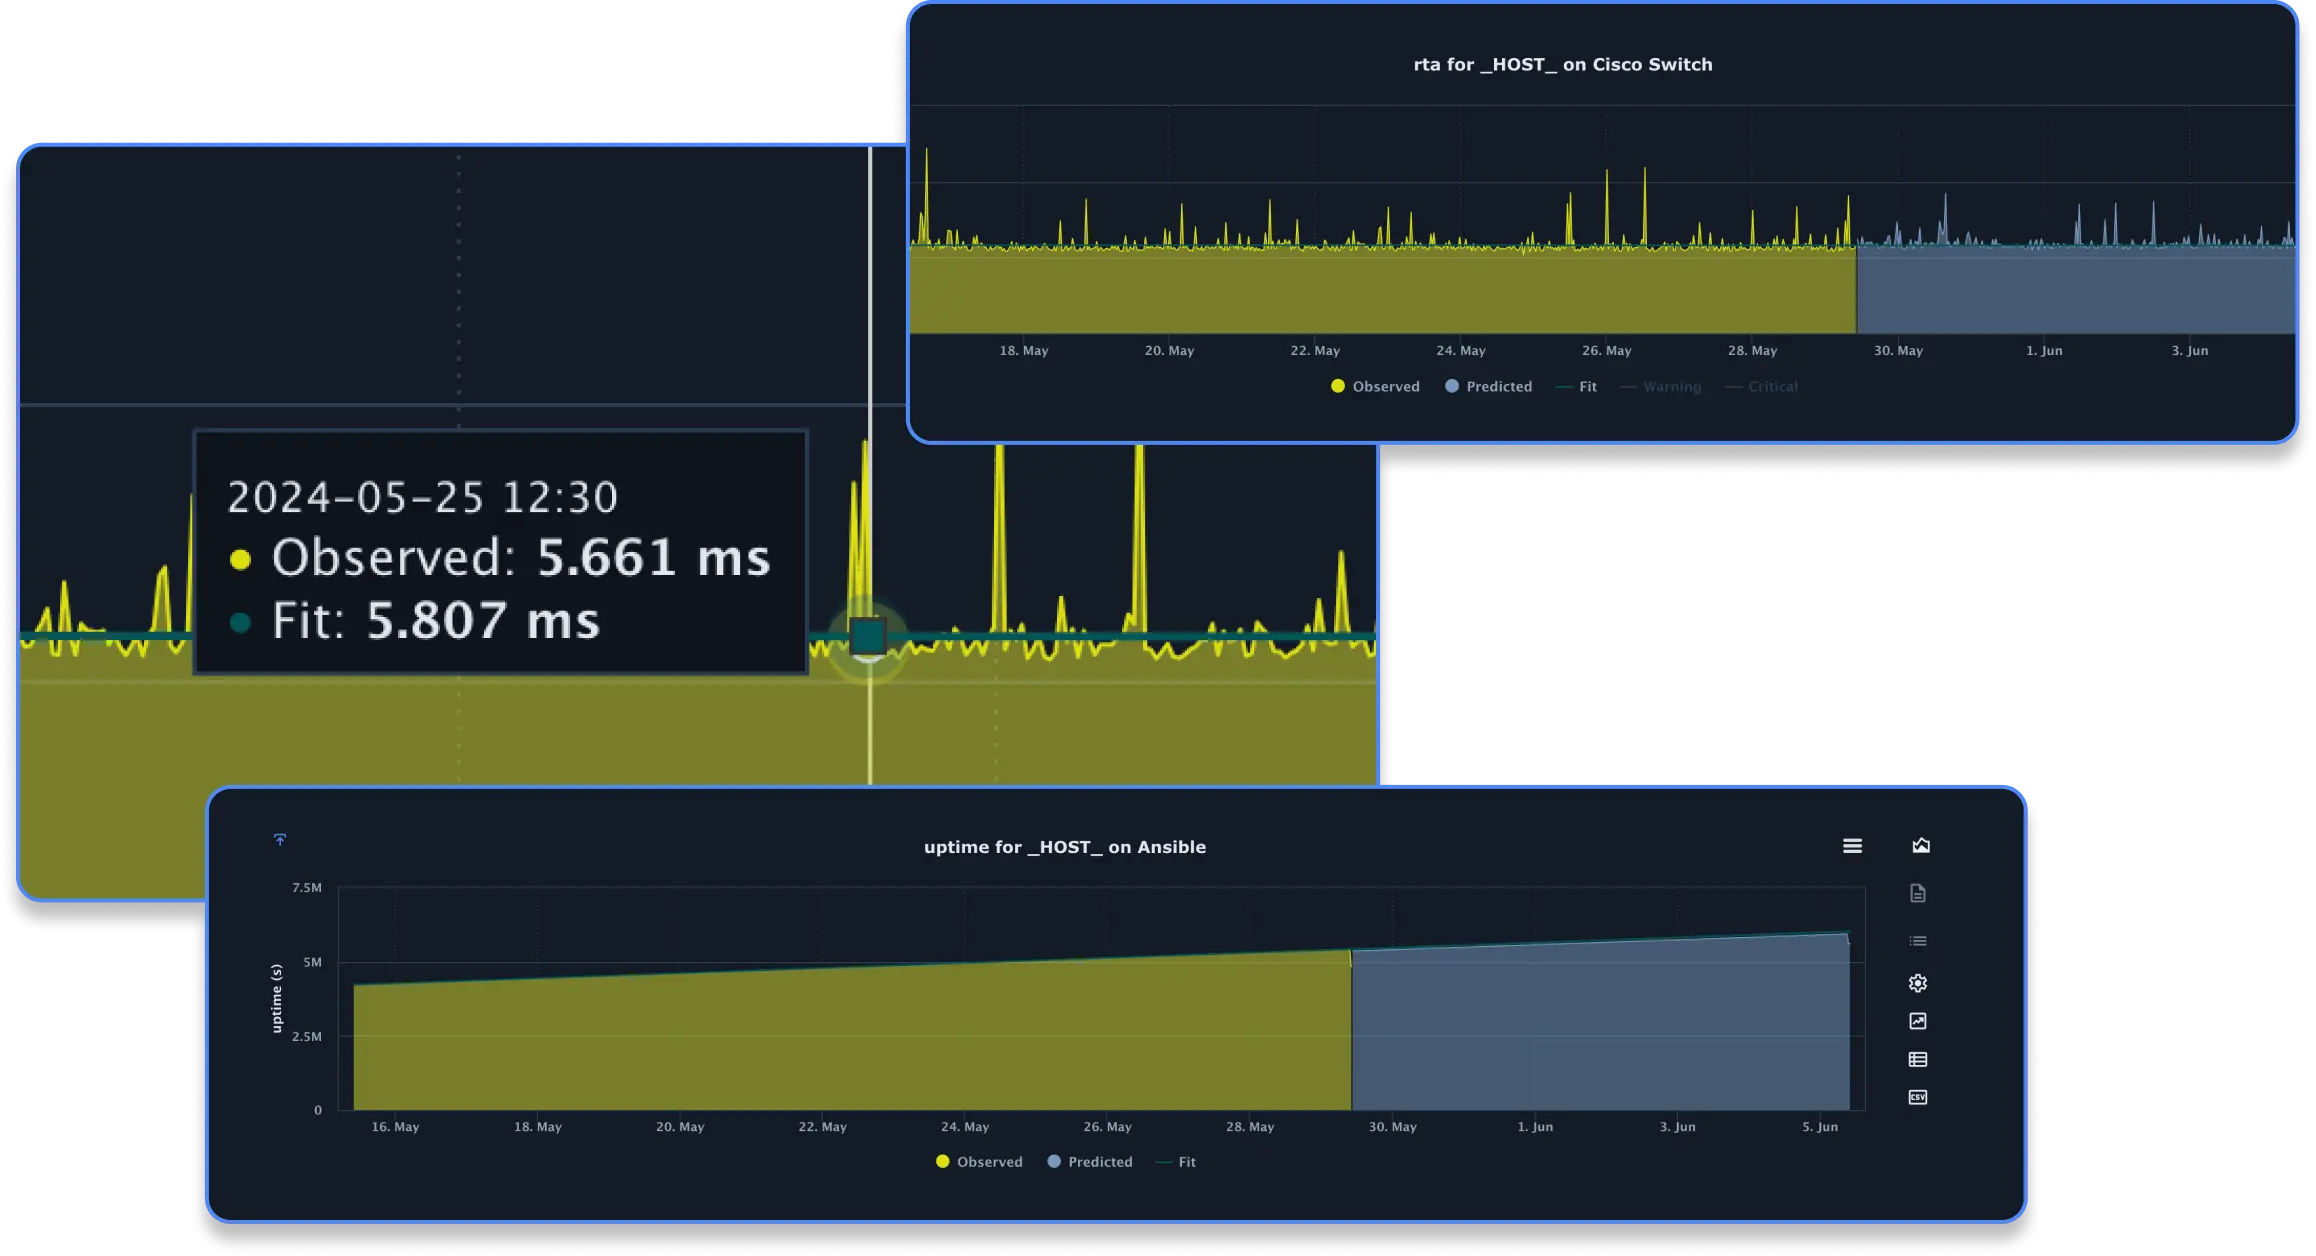
Automated, integrated trending and capacity planning graphs allow organizations to plan for upgrades.
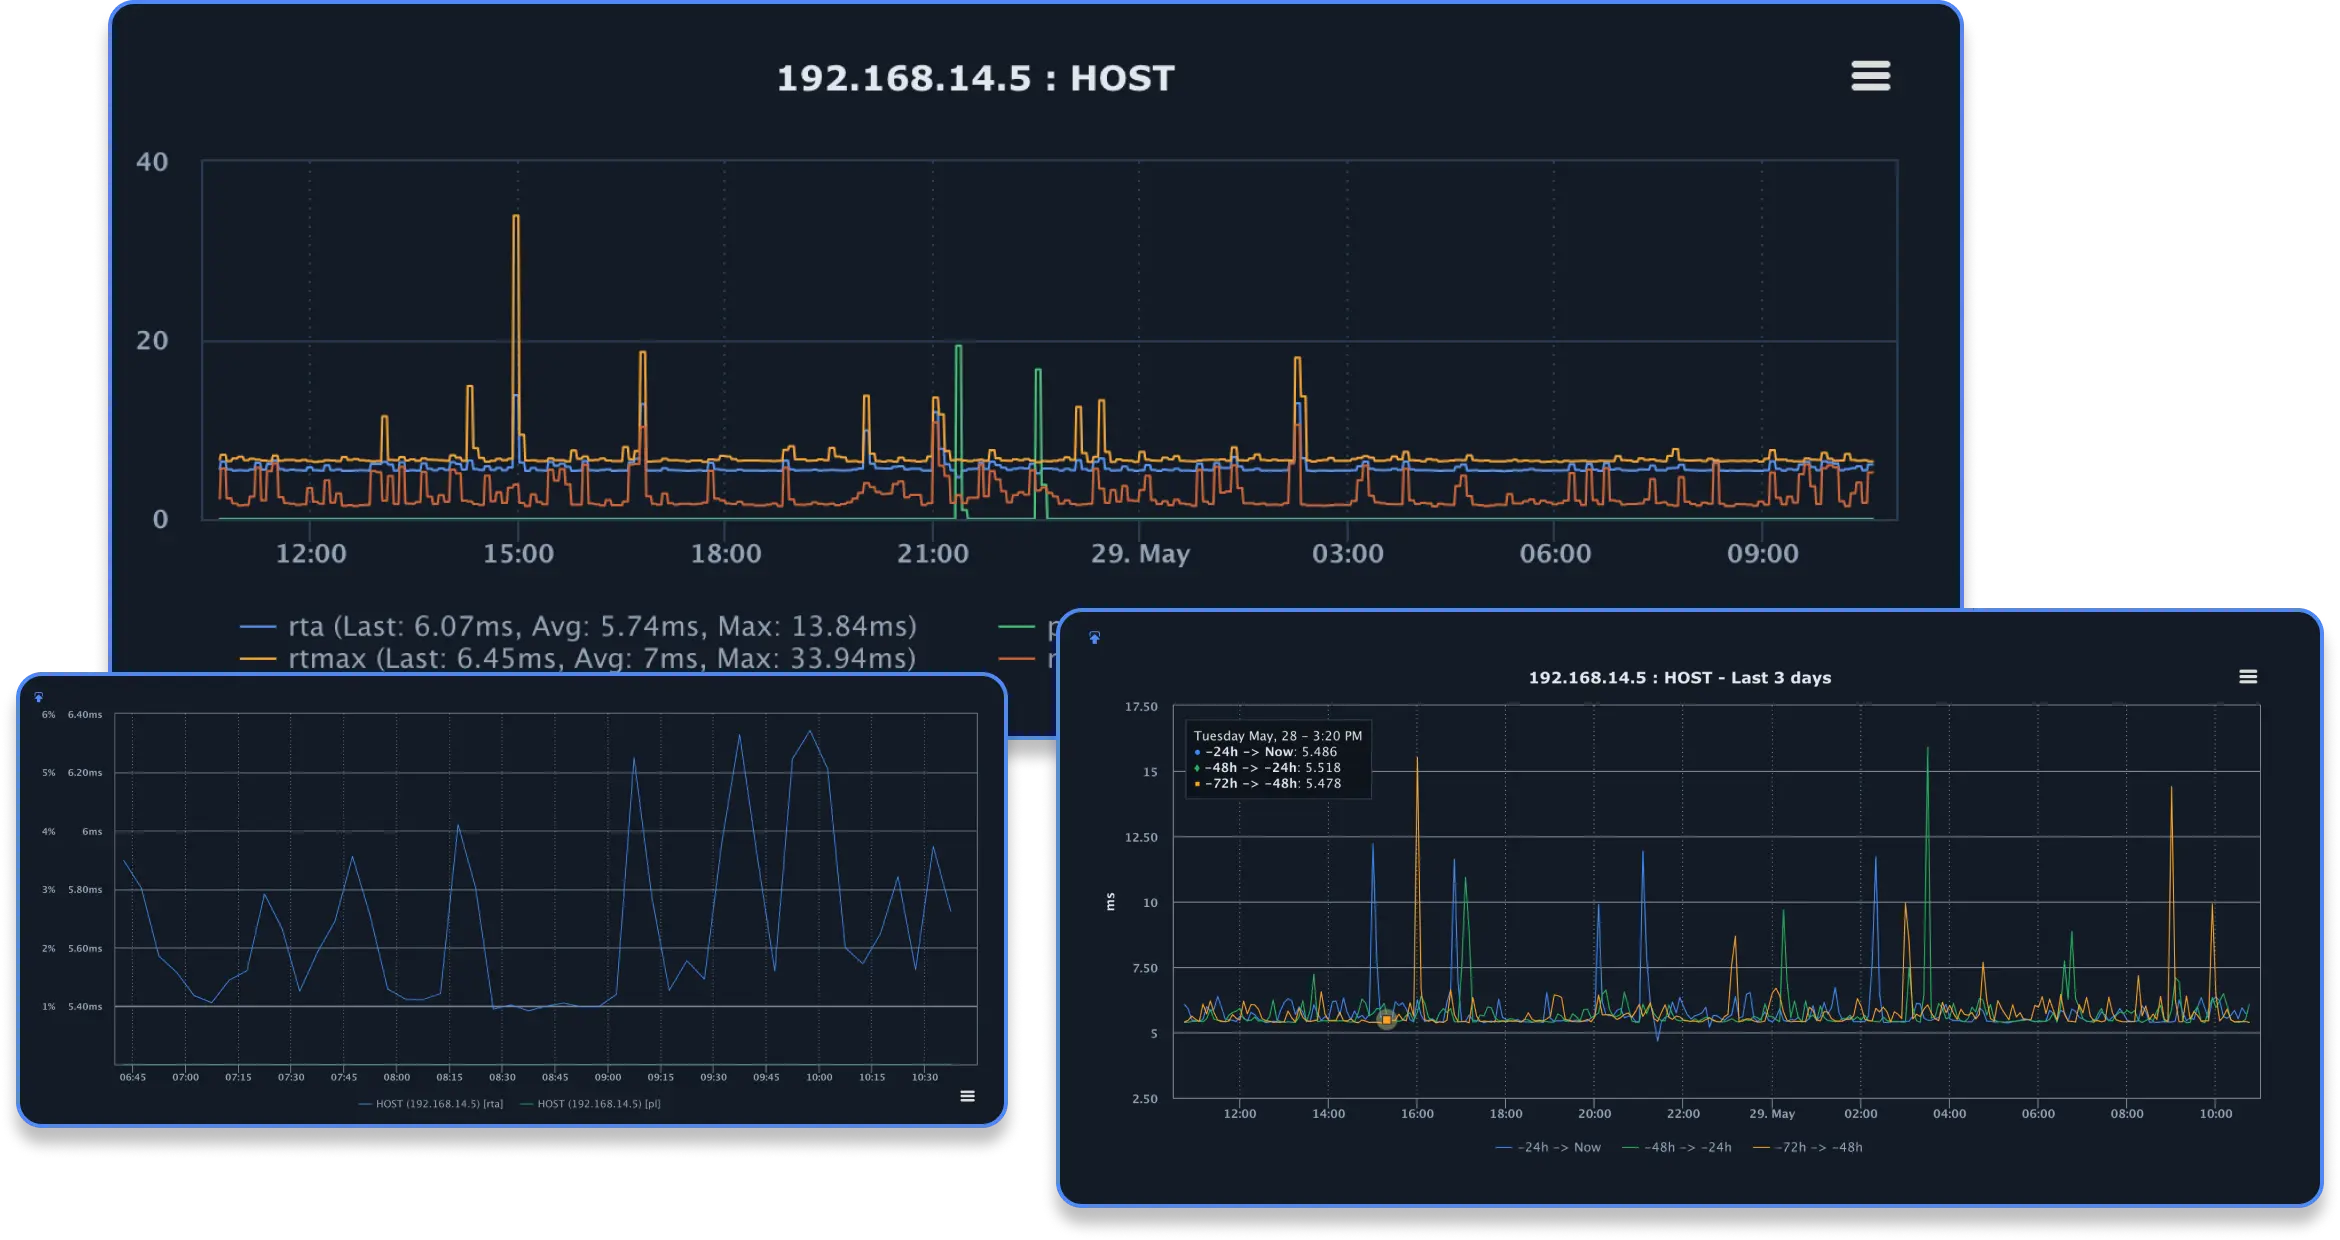
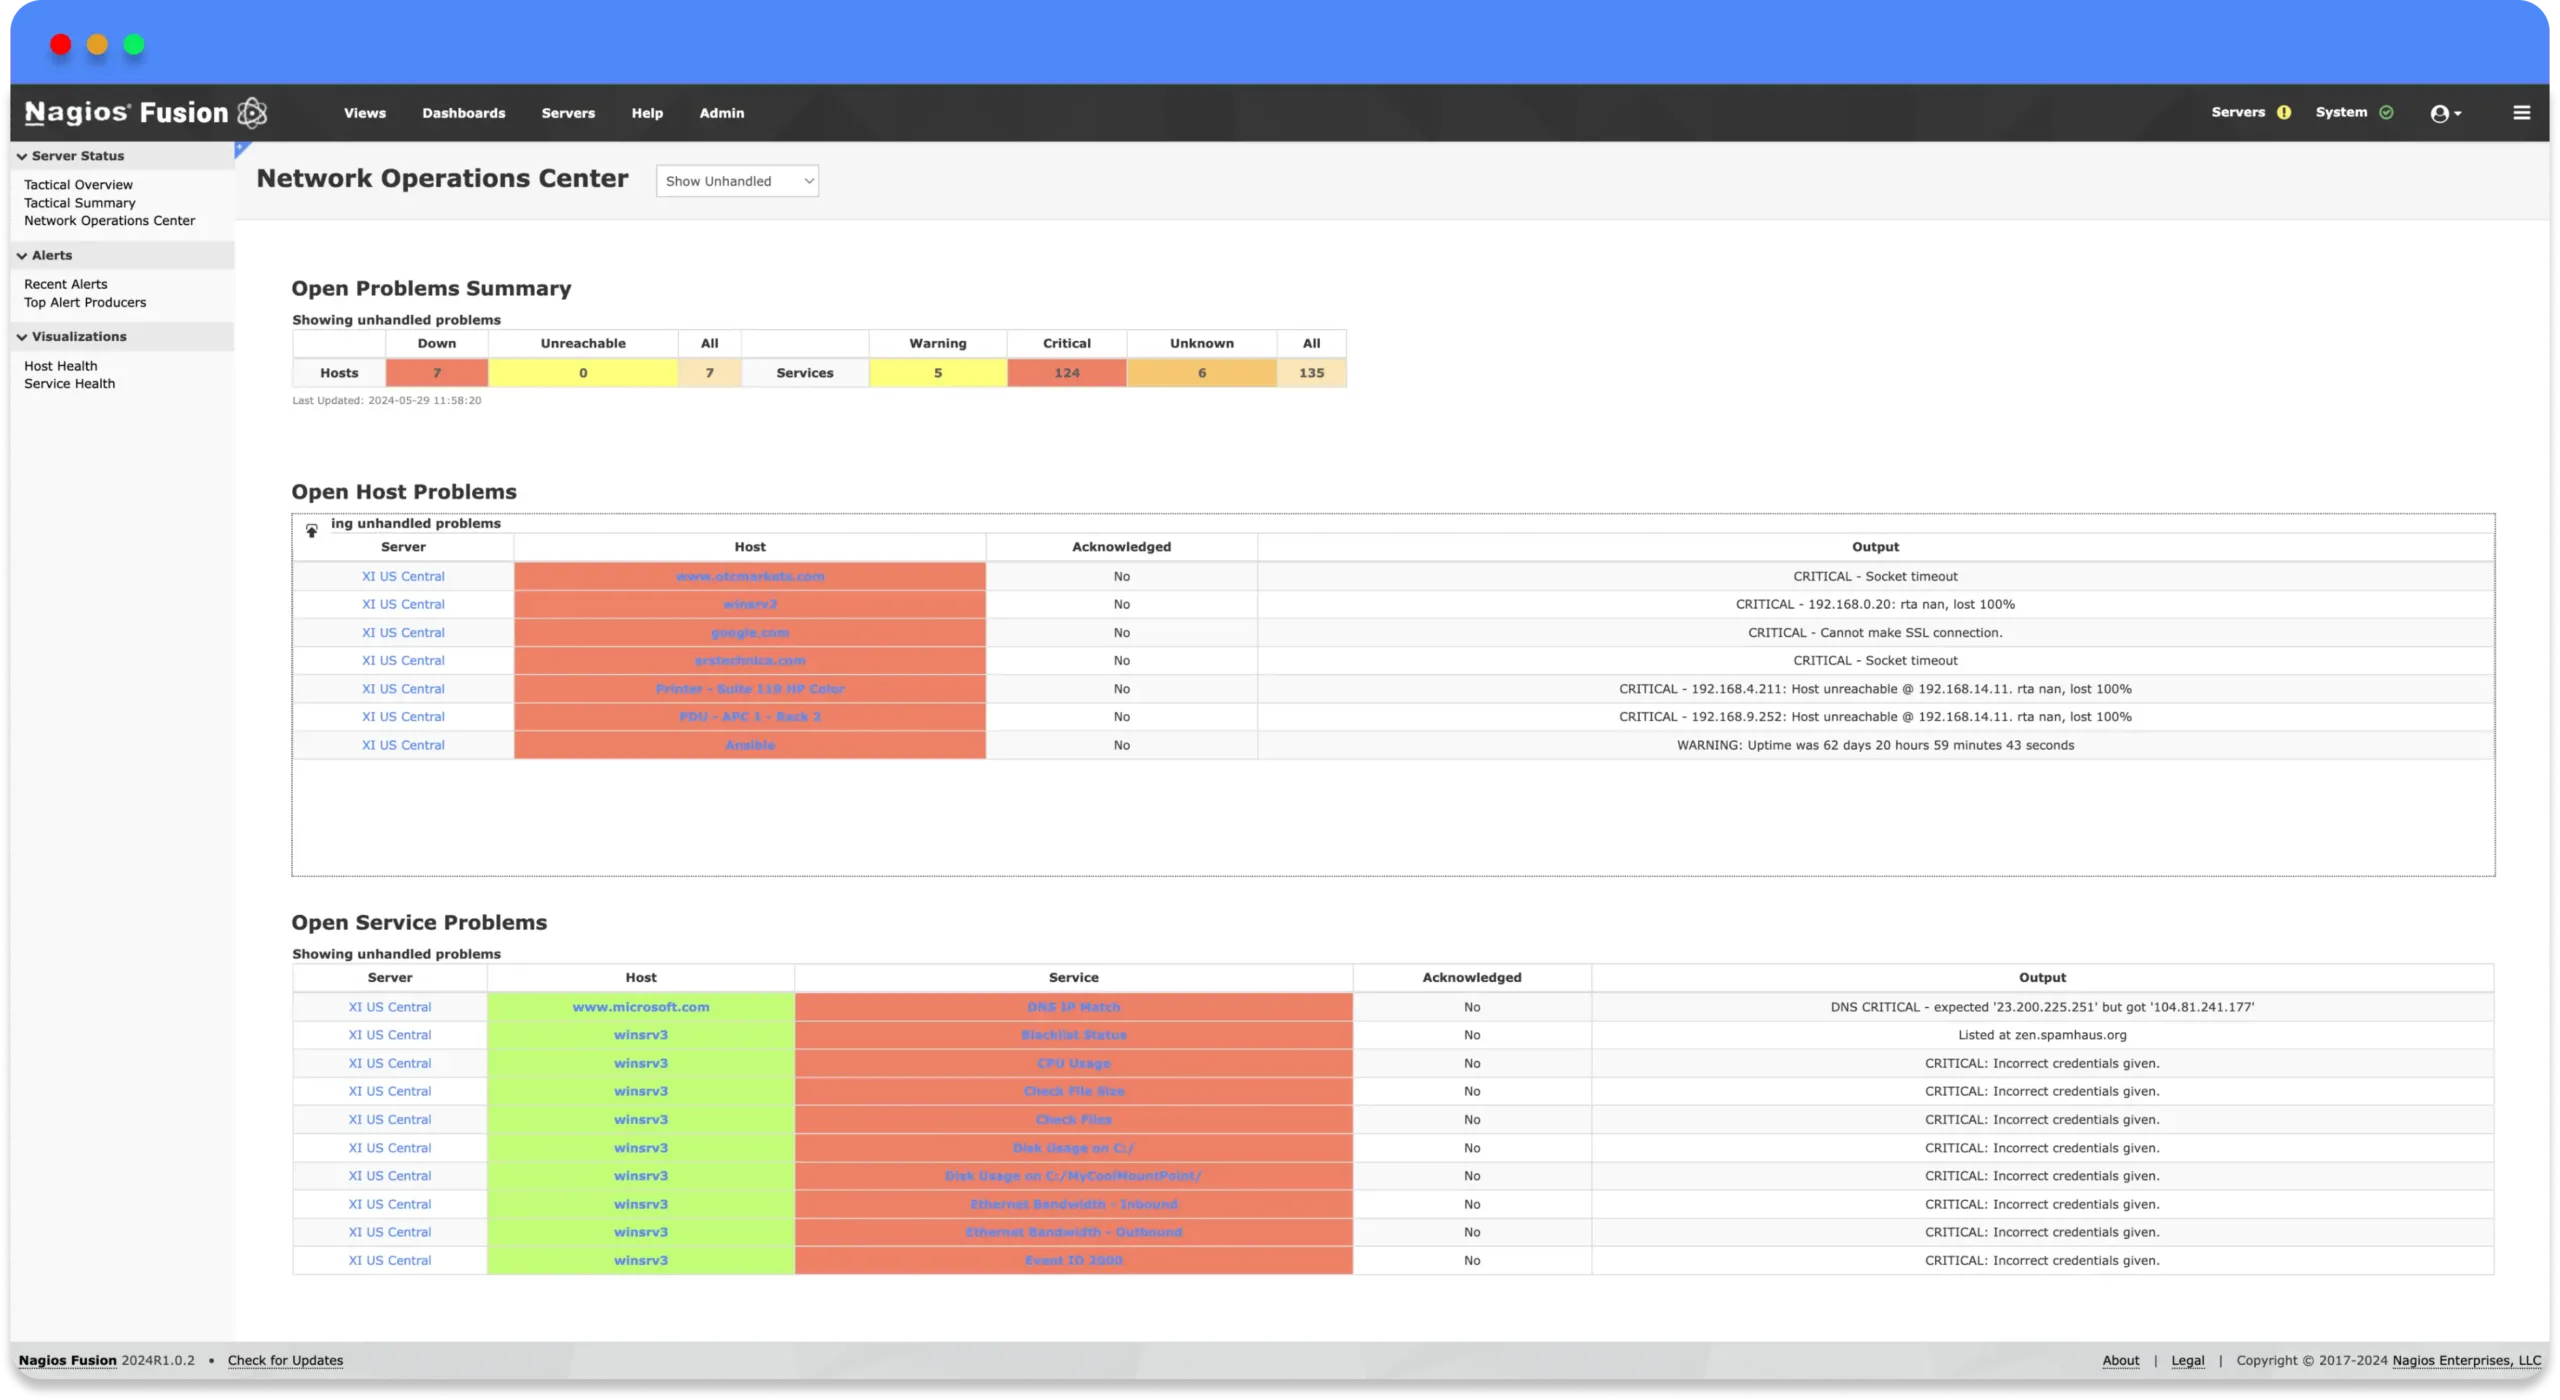
Administrators can easily view network incidents and resolve them before they become major catastrophes.
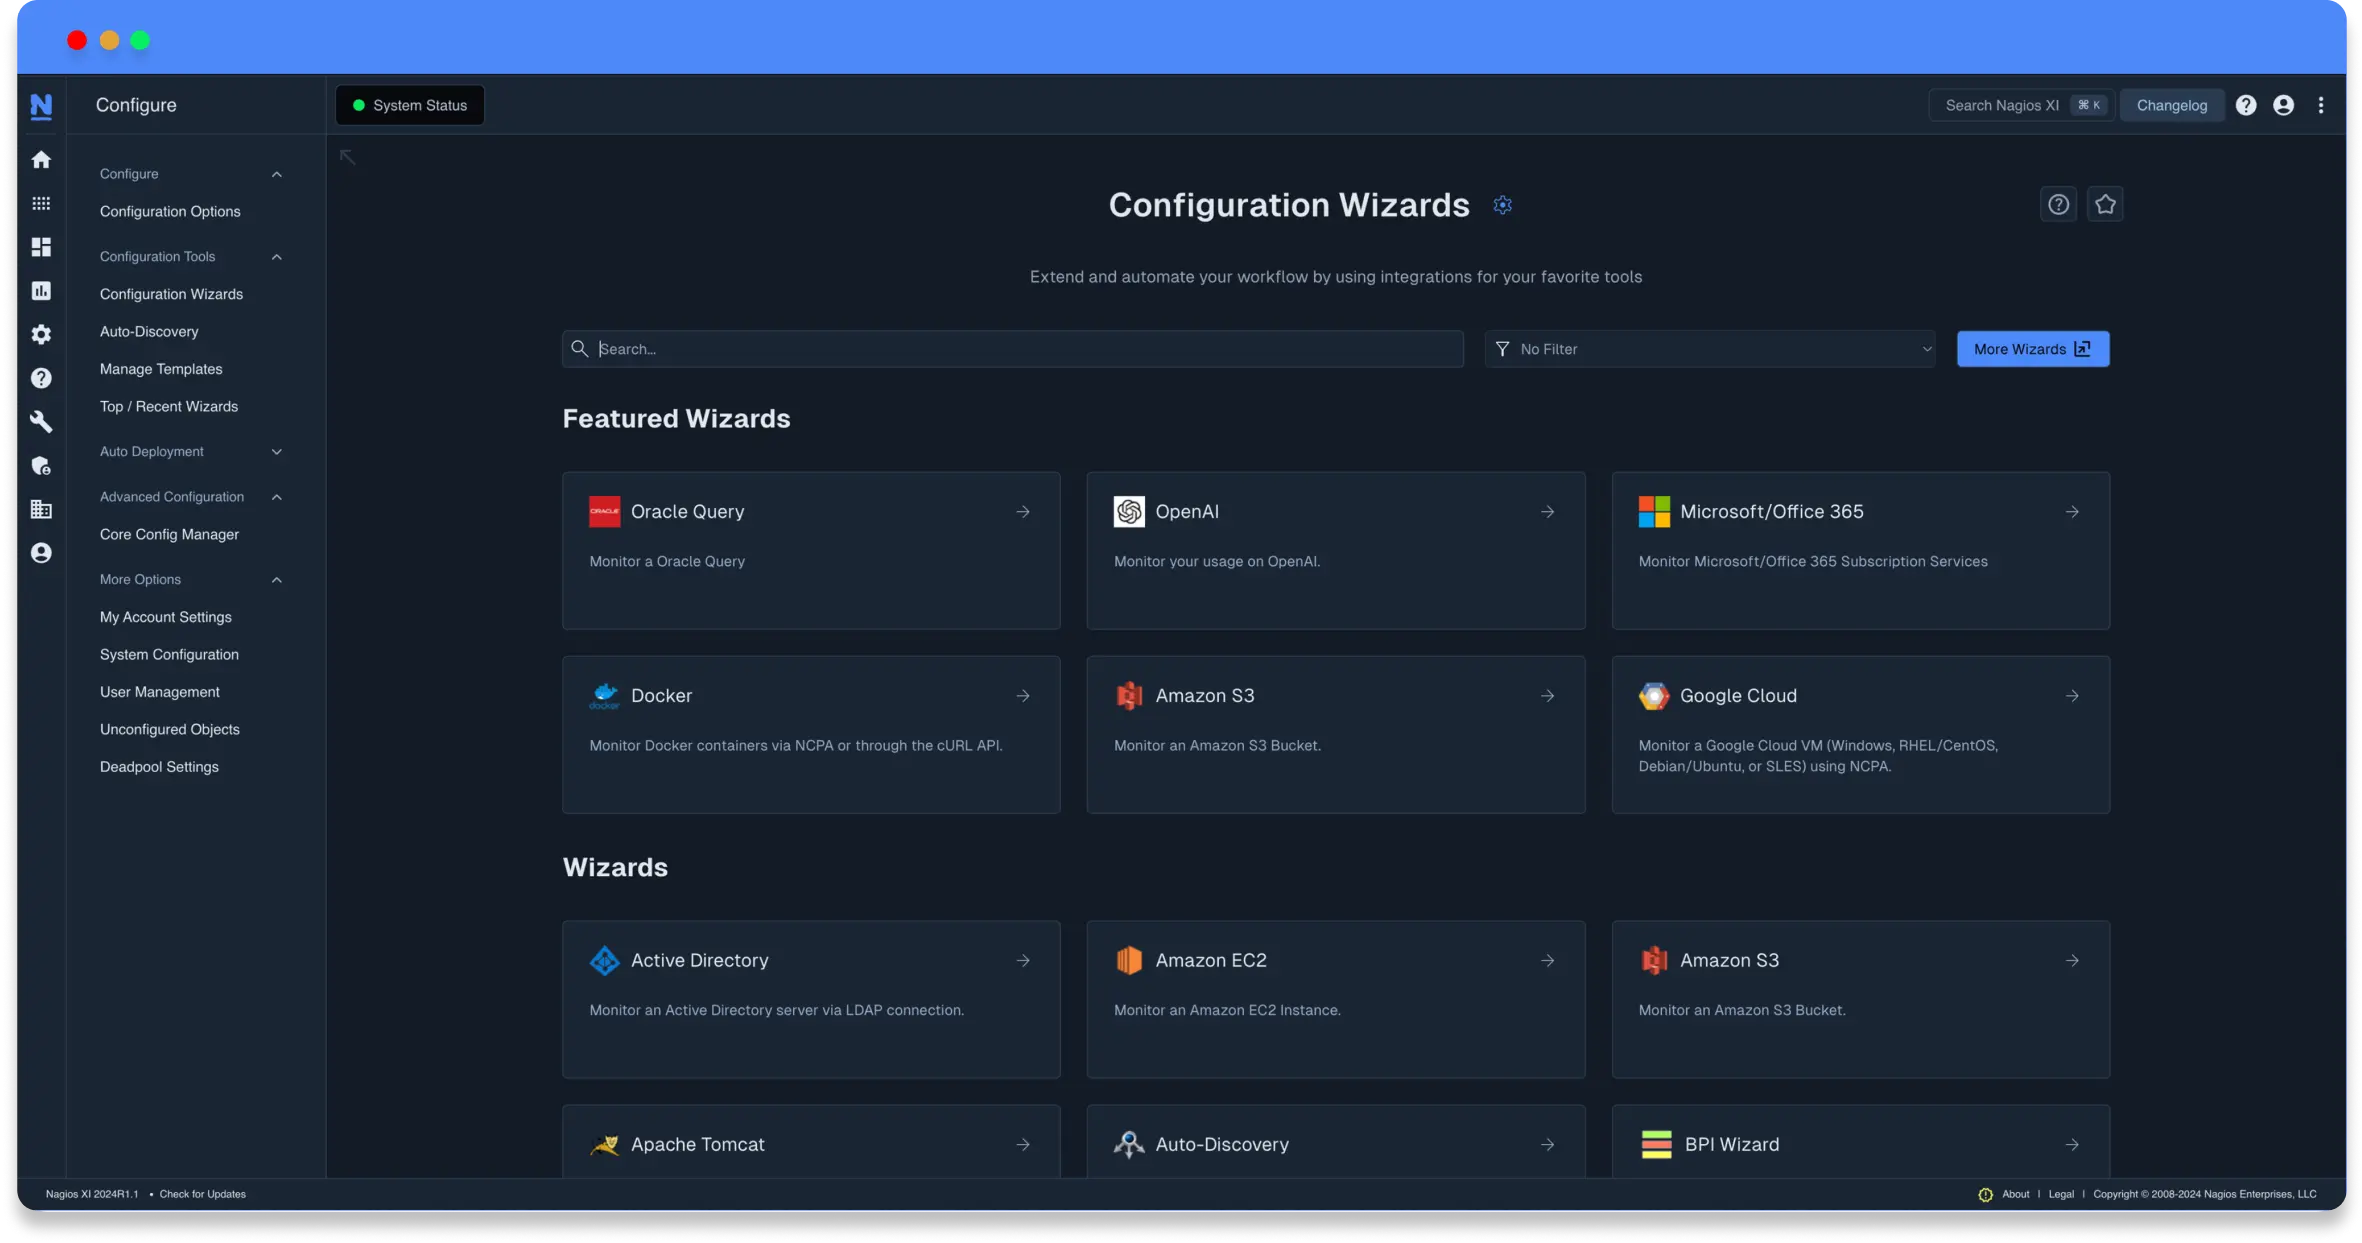
Get monitoring in a few simple clicks by simply entering the required information into our easy-to-use Wizards.
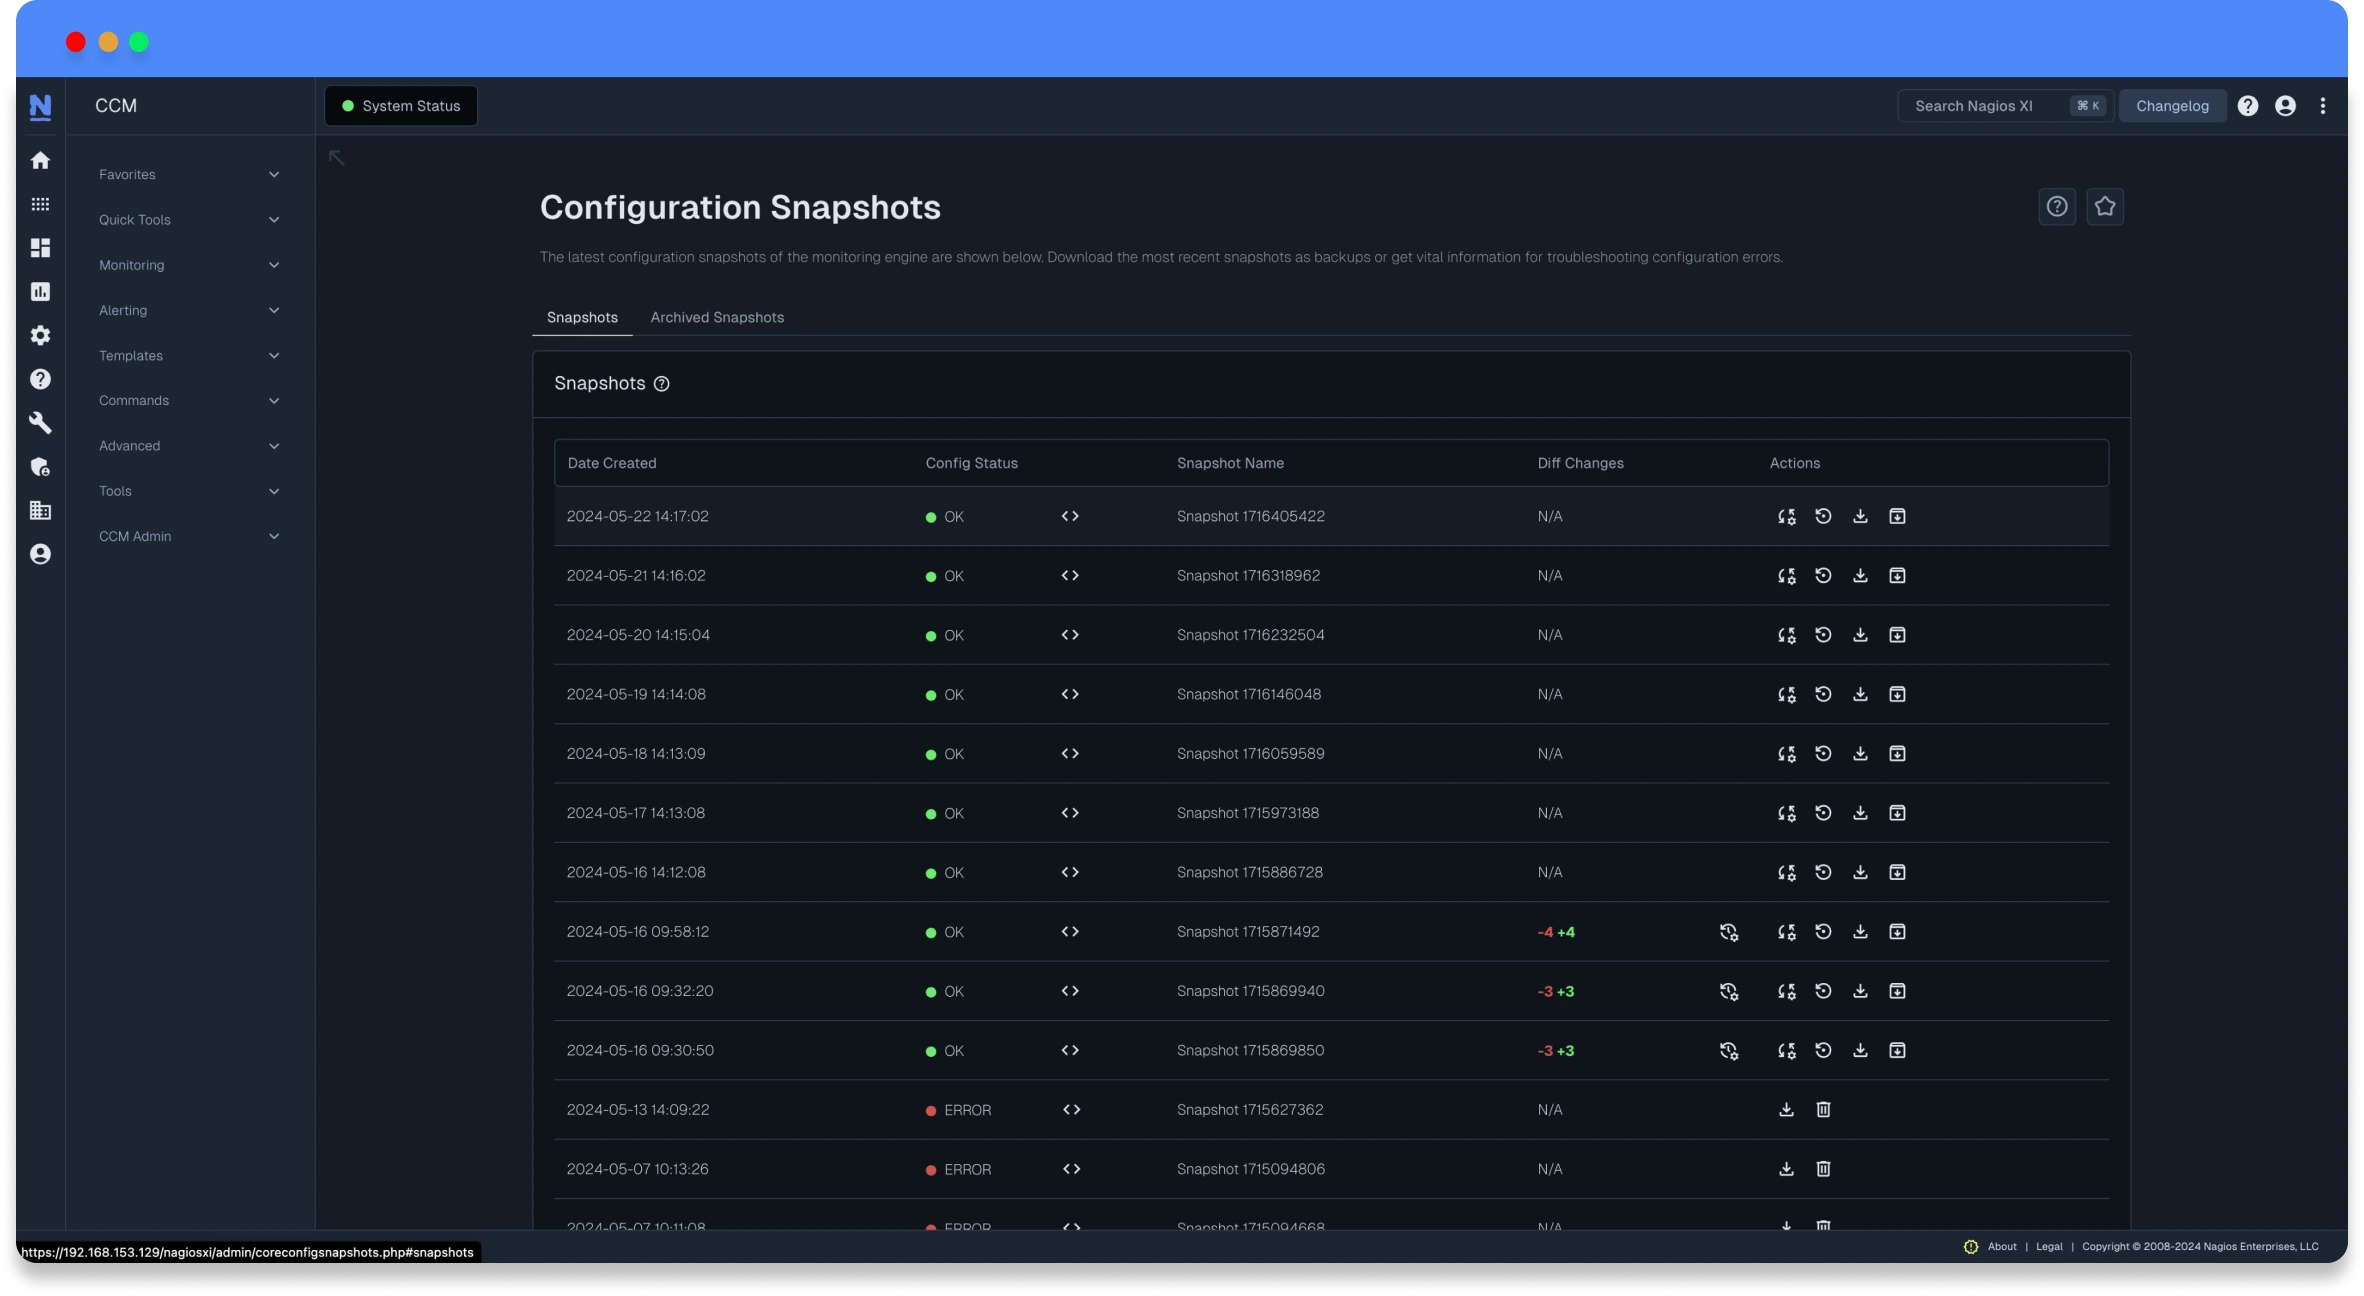
Save your most recent configurations. Archive it. Revert back whenever you like. Never lose it again. Relax.
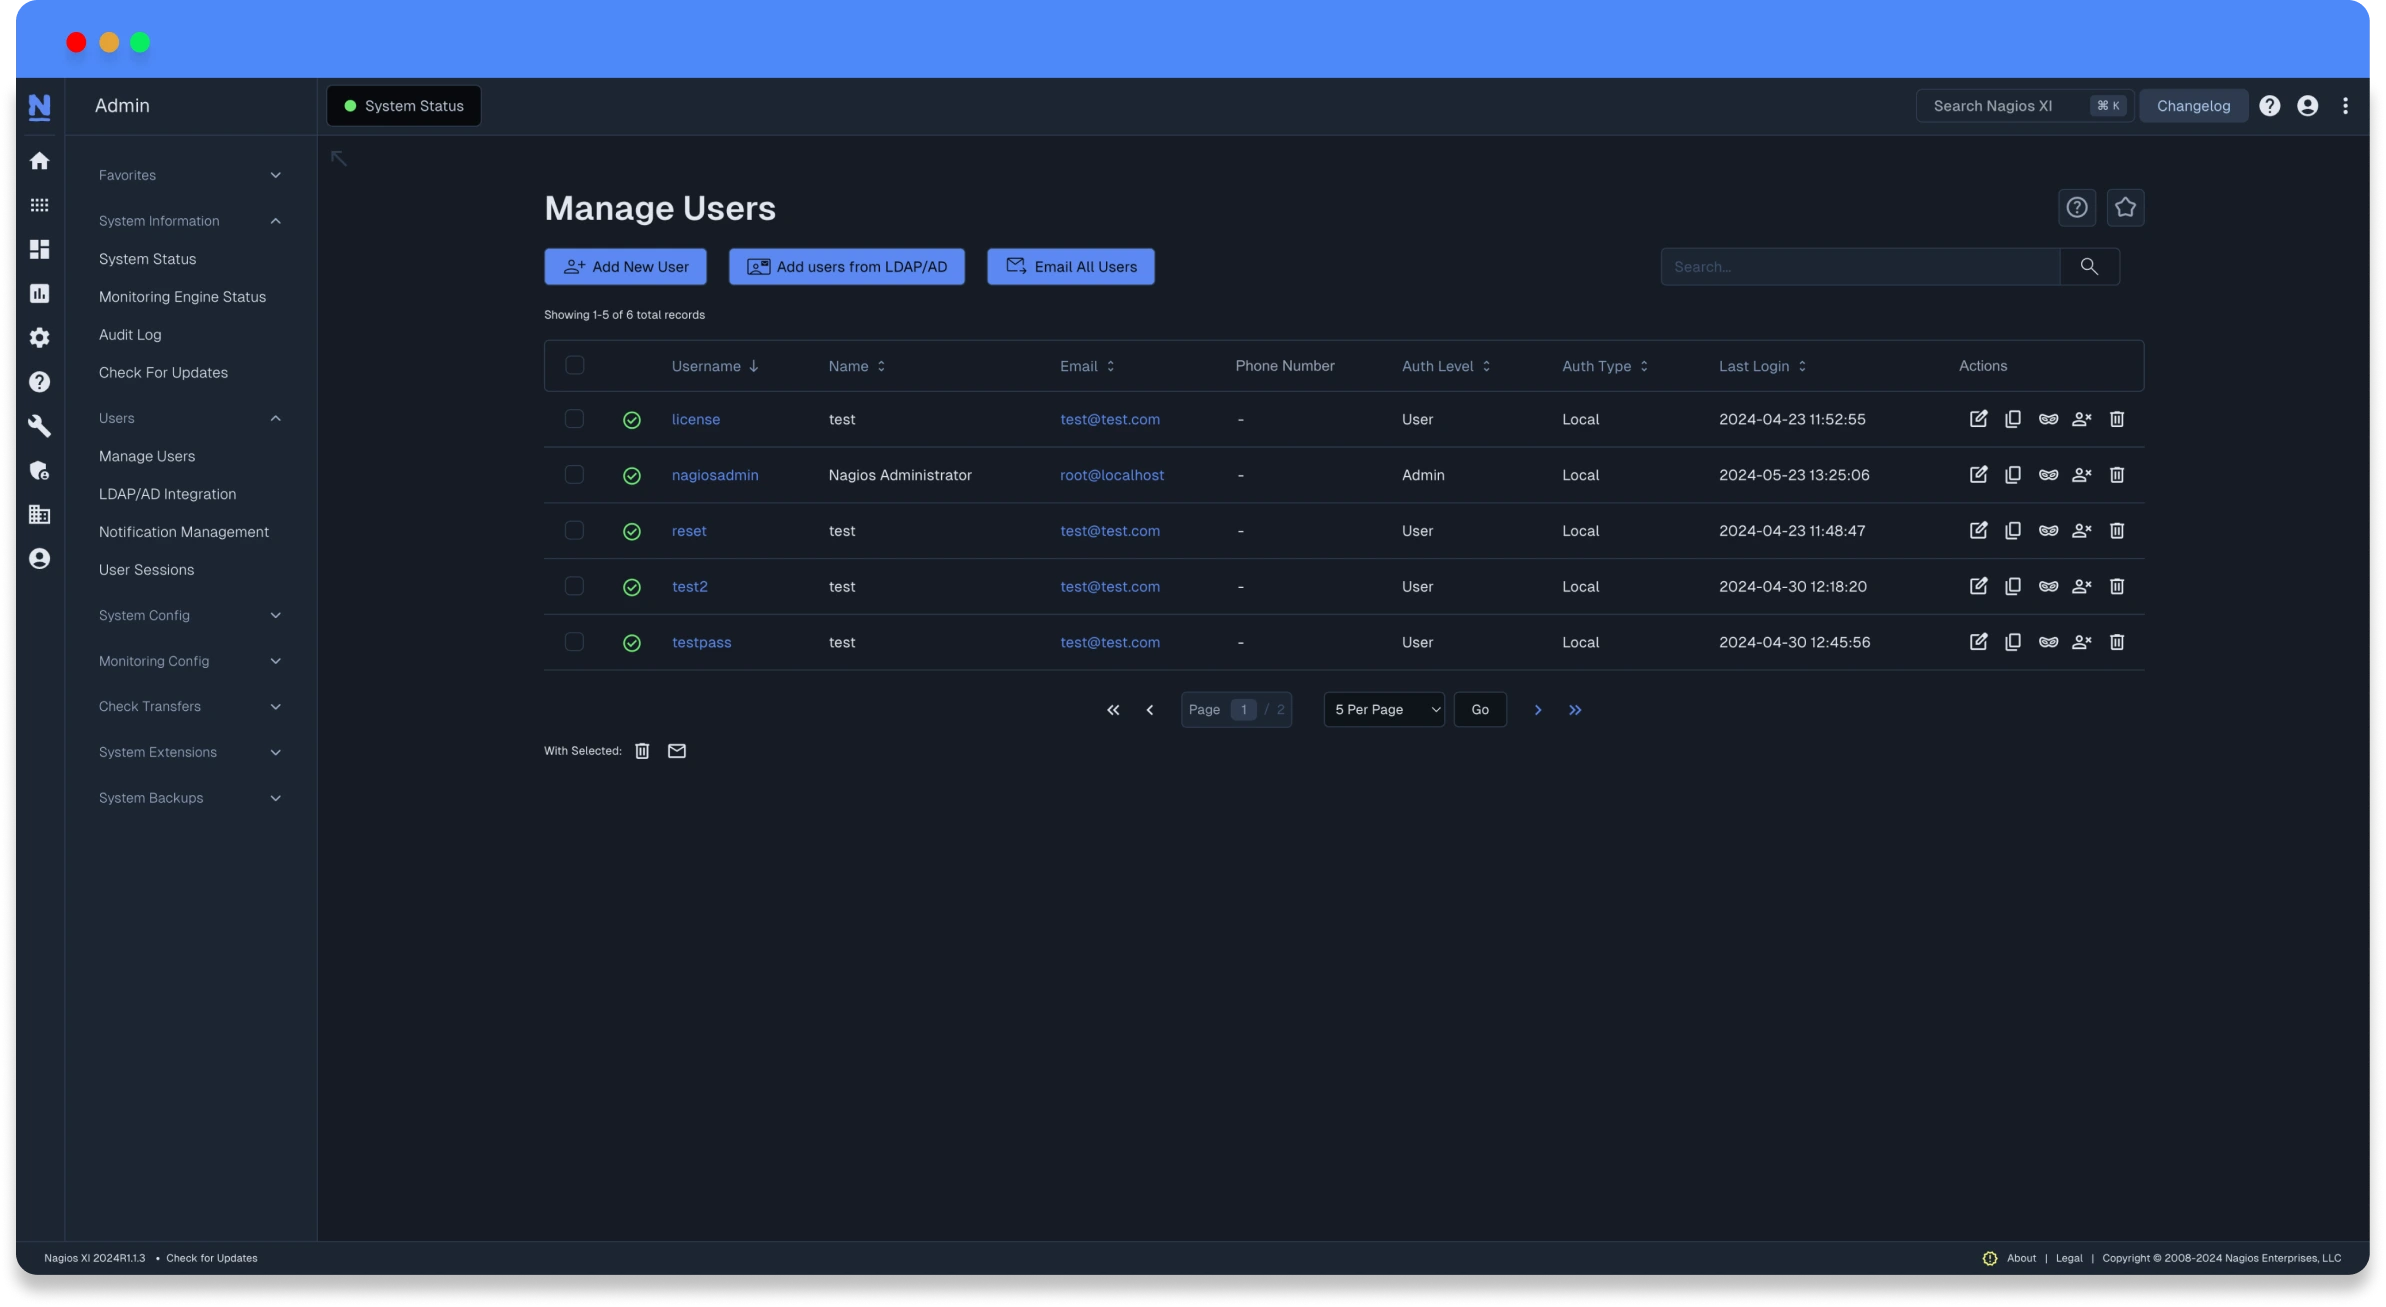
Easily setup and manage user accounts with only a few clicks then assign custom roles to ensure a secure environment.
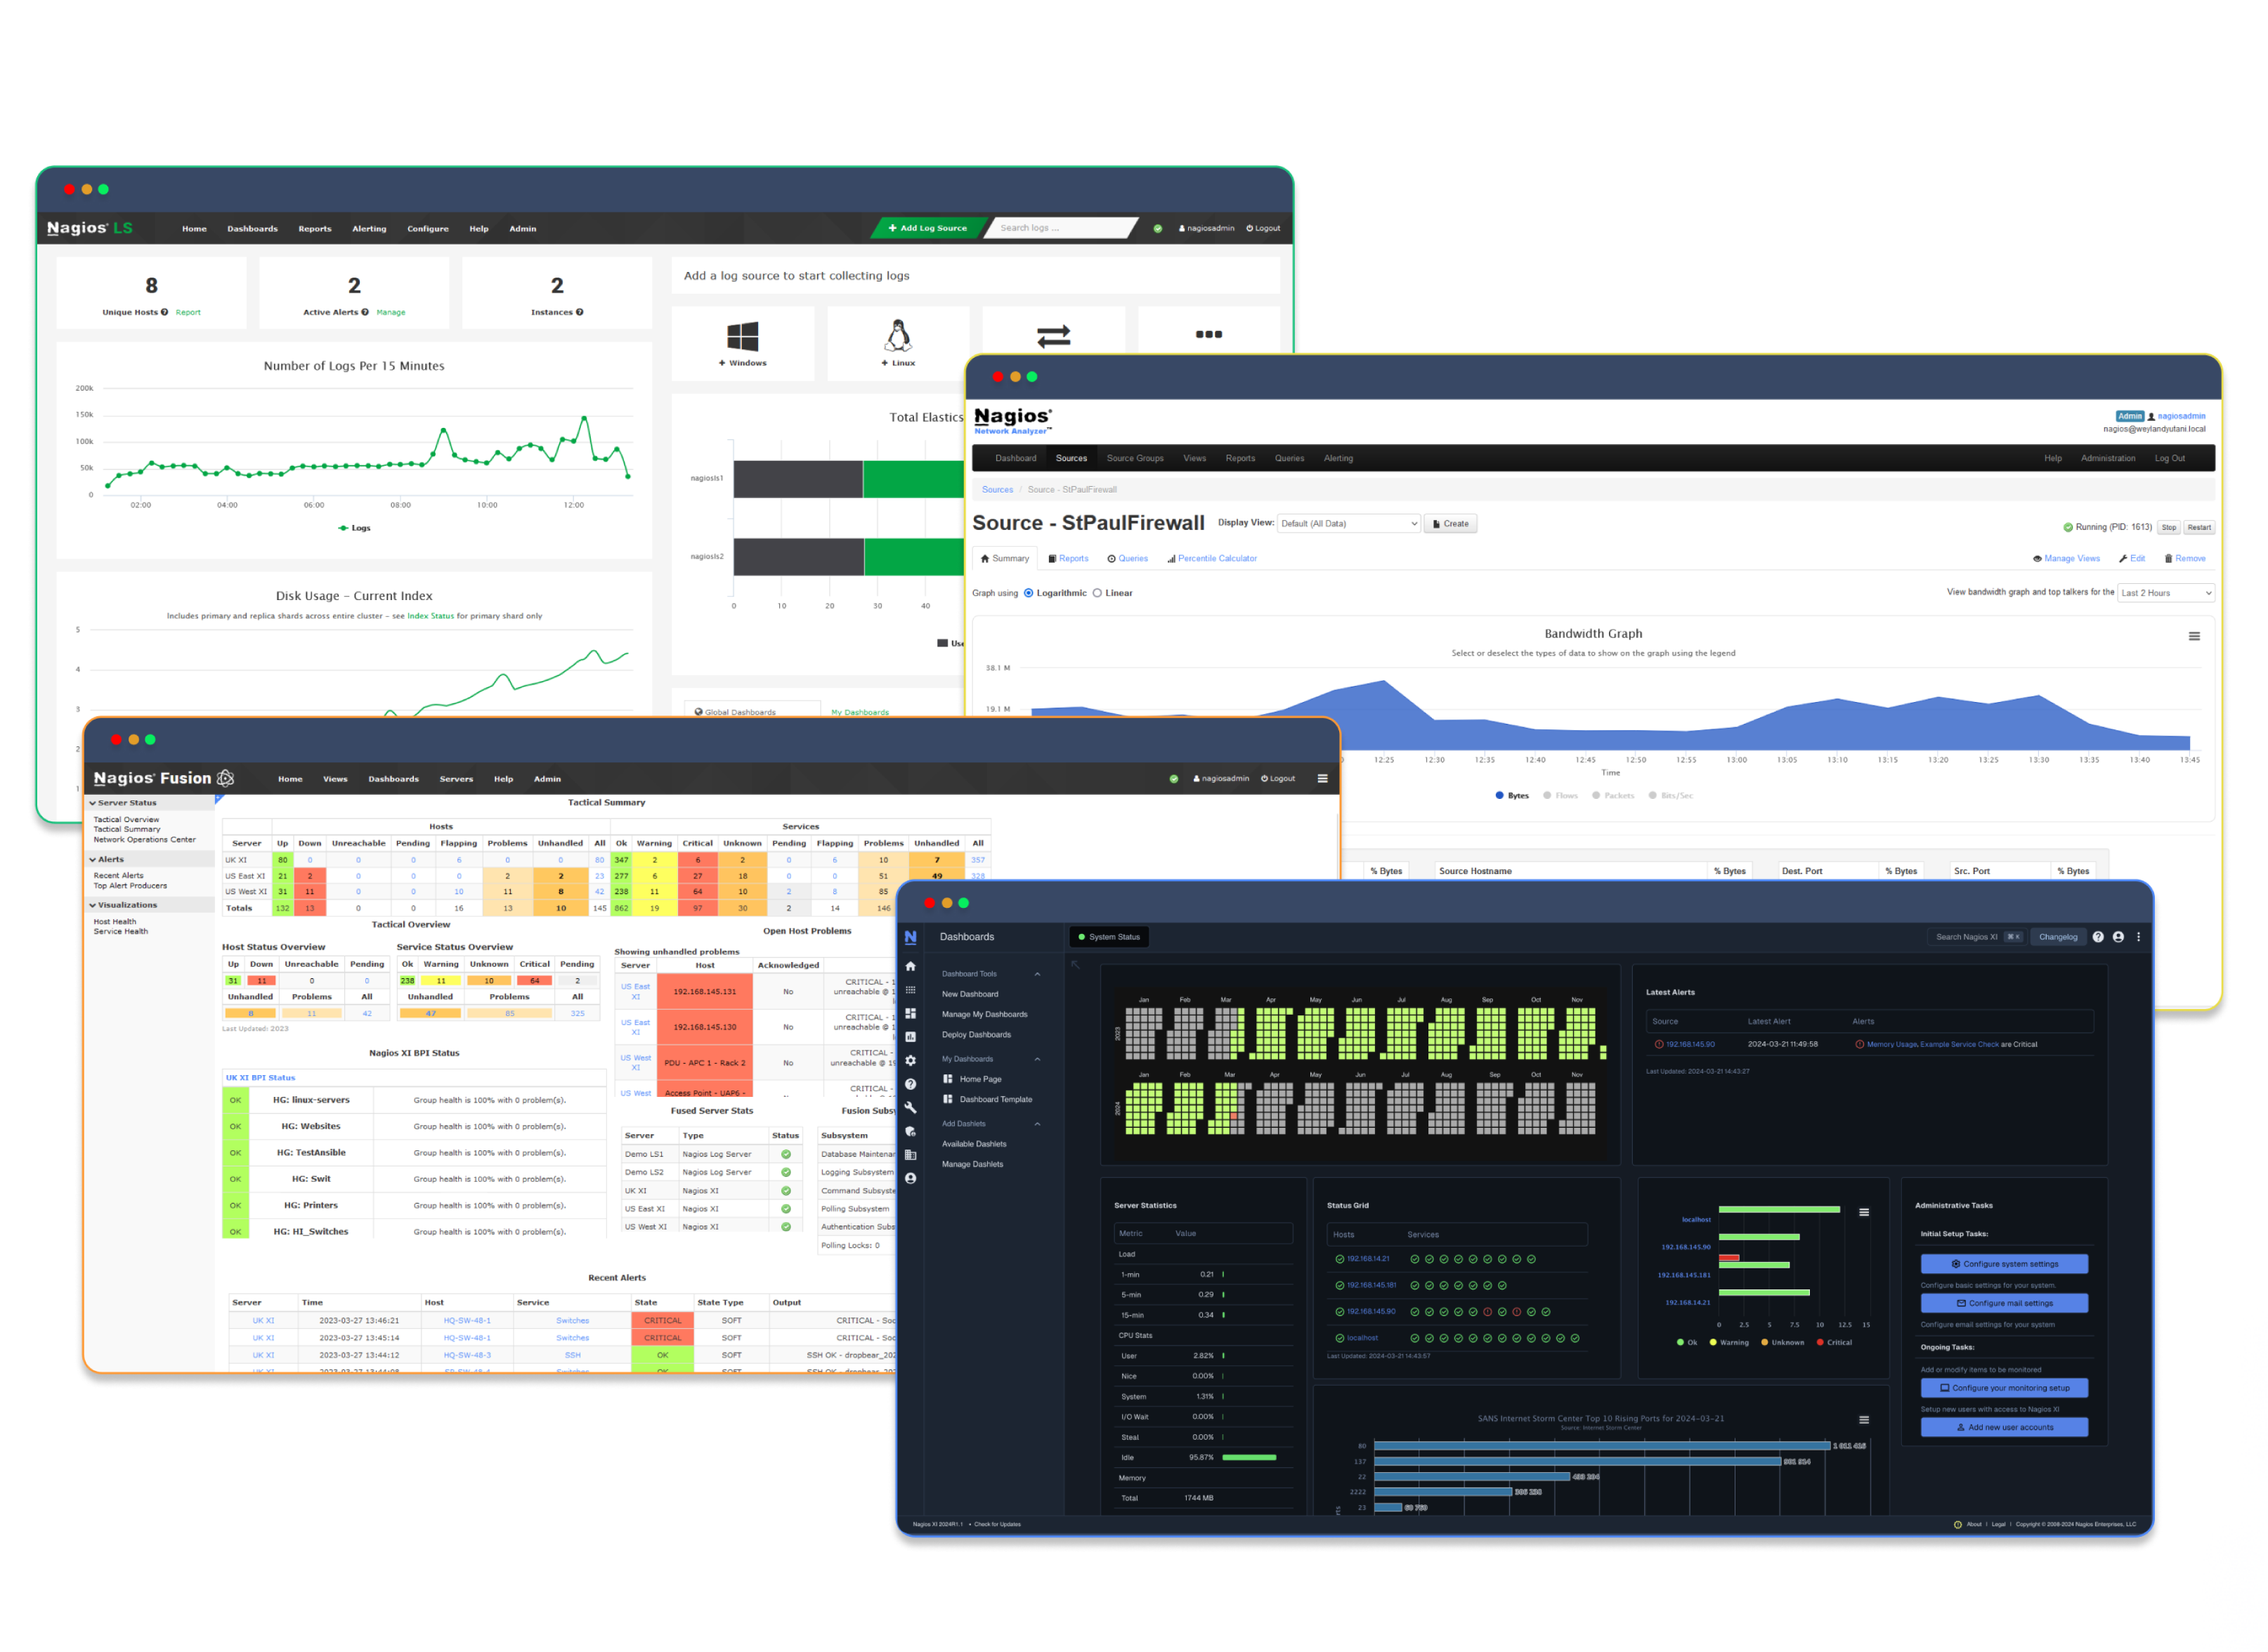
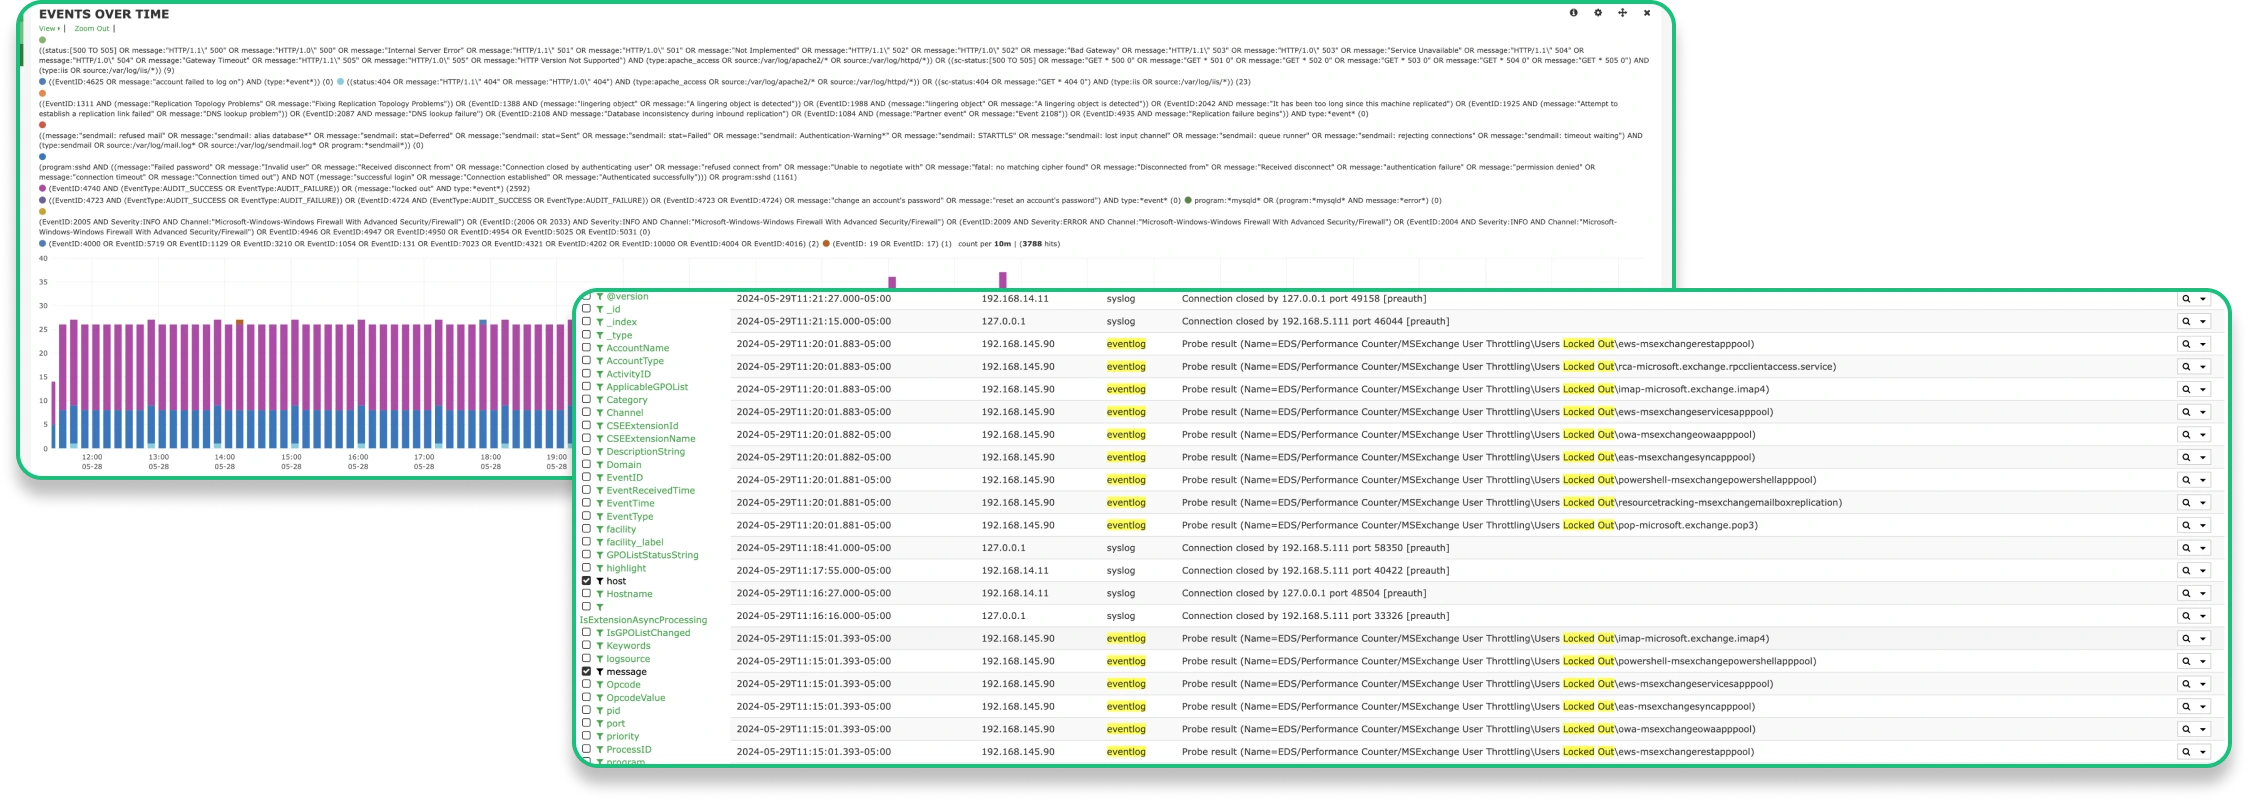
A powerful dashboard system provides users with the ability to query, filter, and analyze incoming log events.
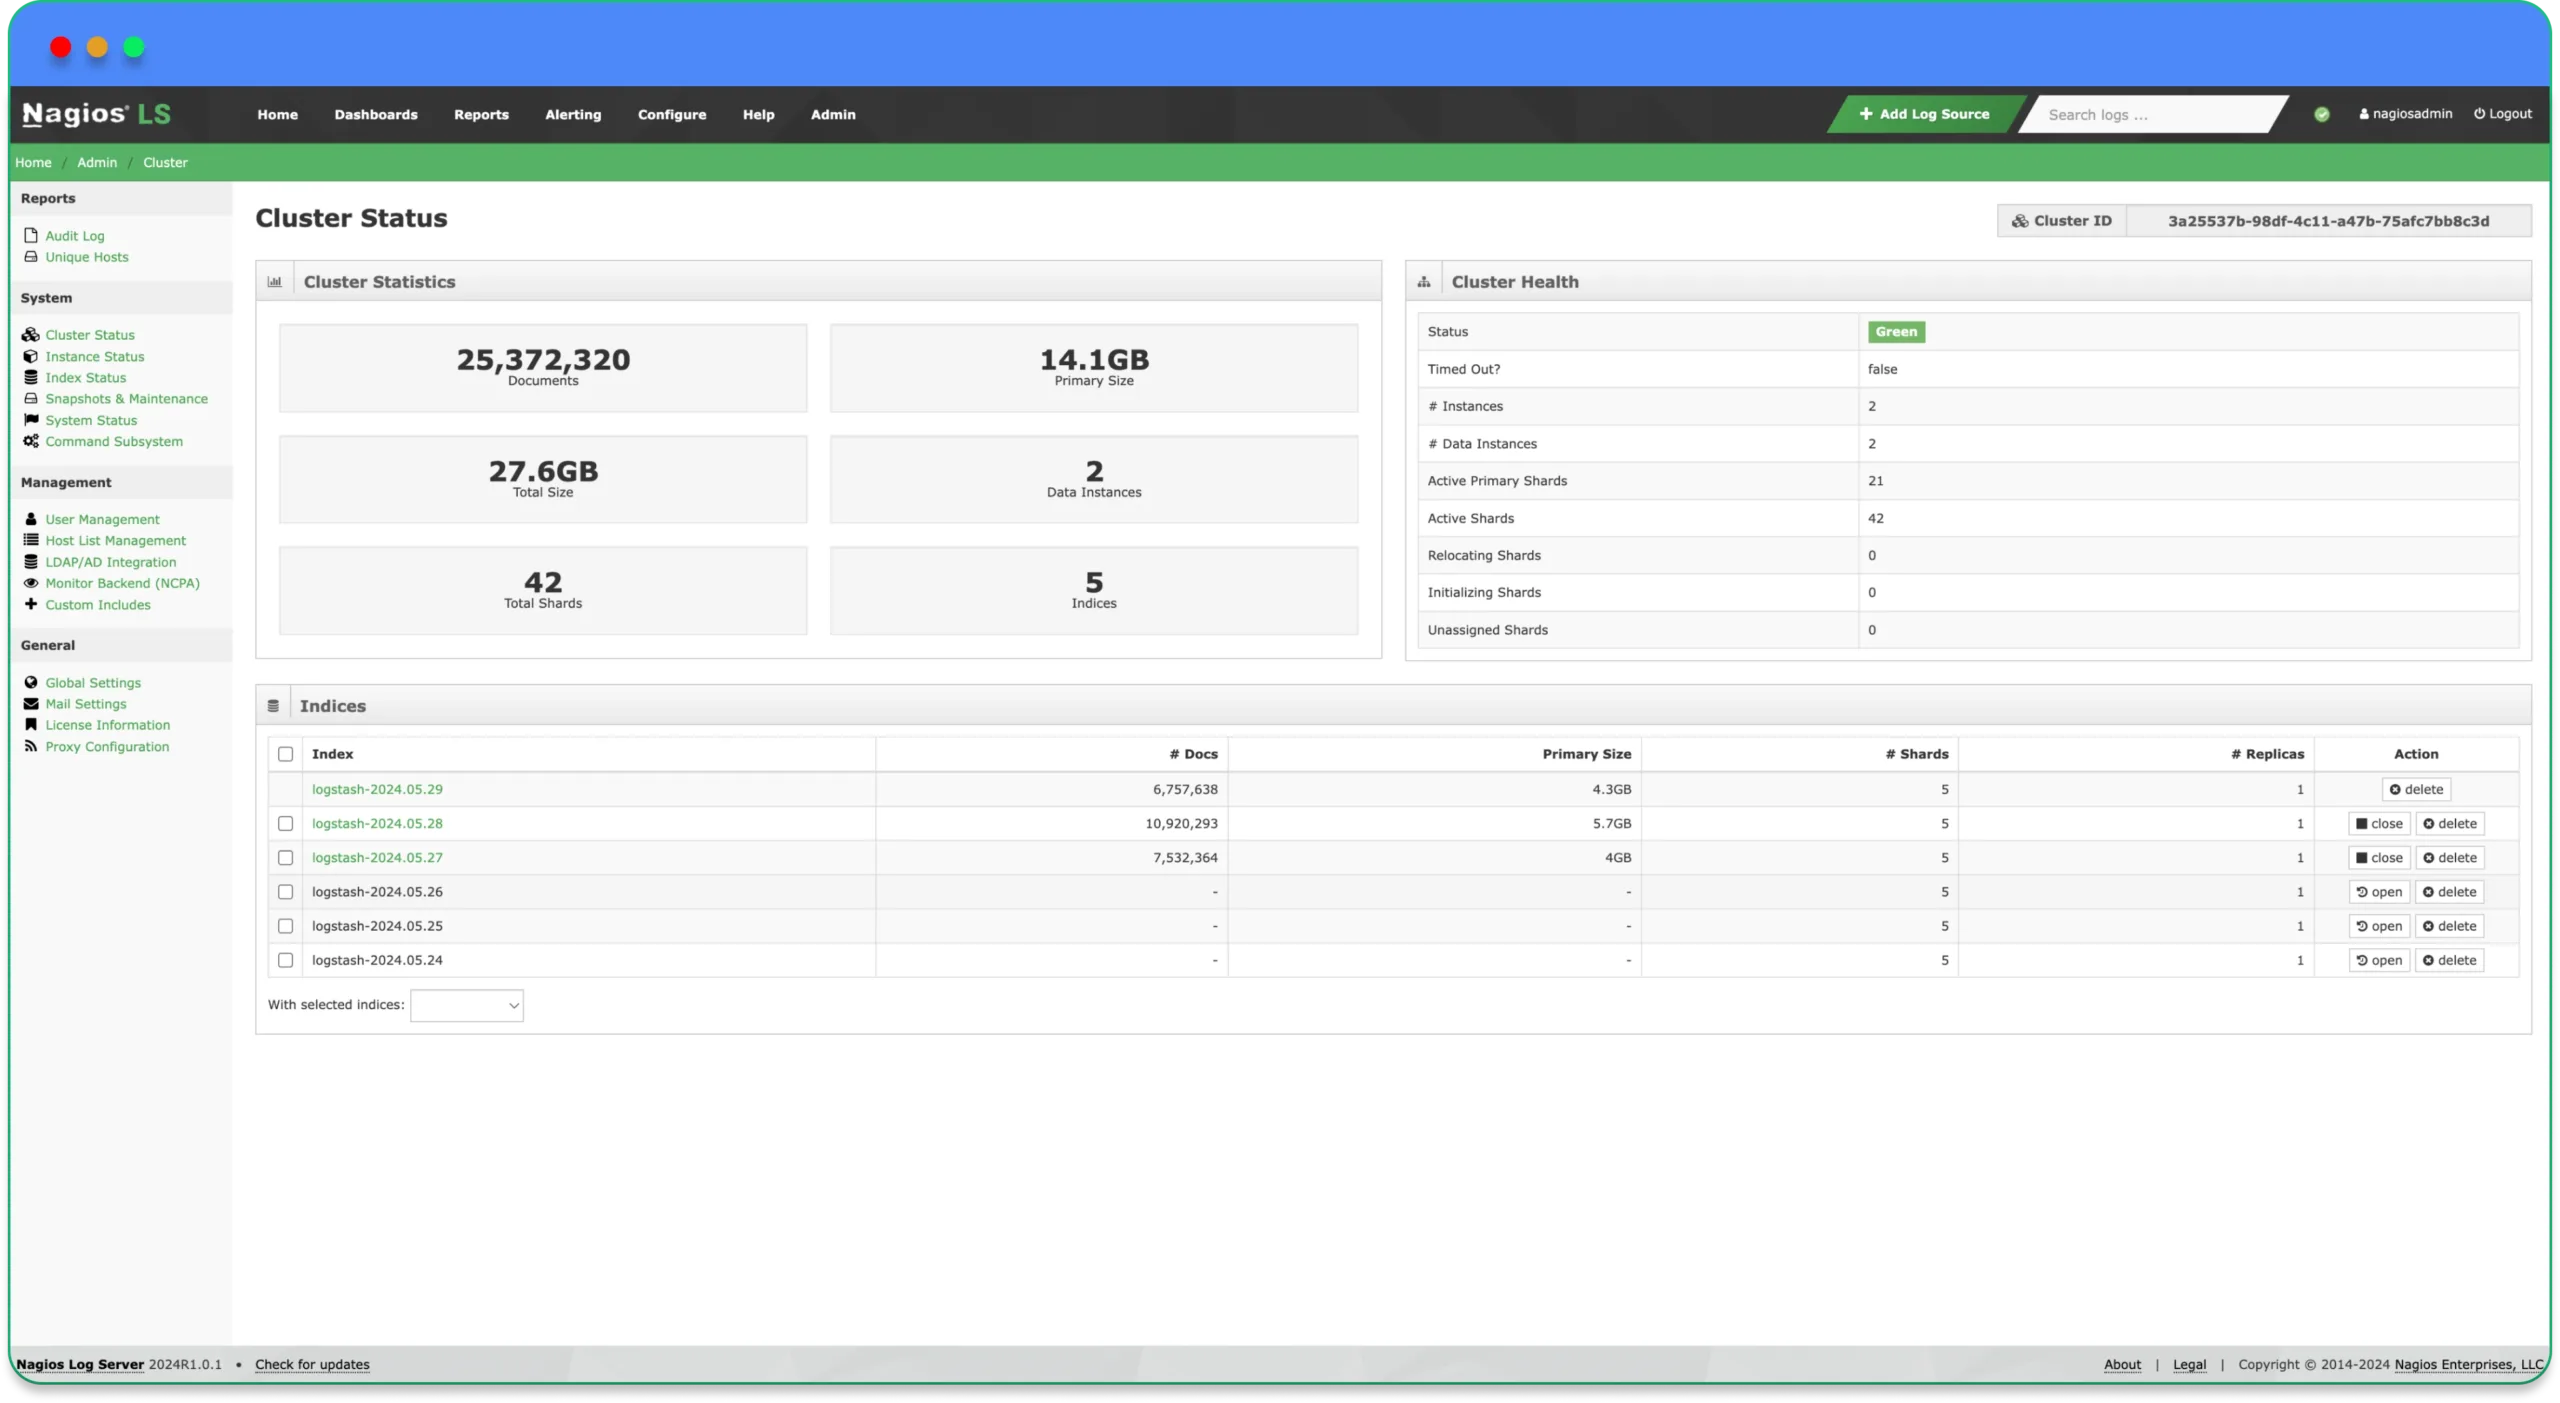
Log Server uses a cluster of servers to store log data to prevent data loss and ensure the availability of your log information.
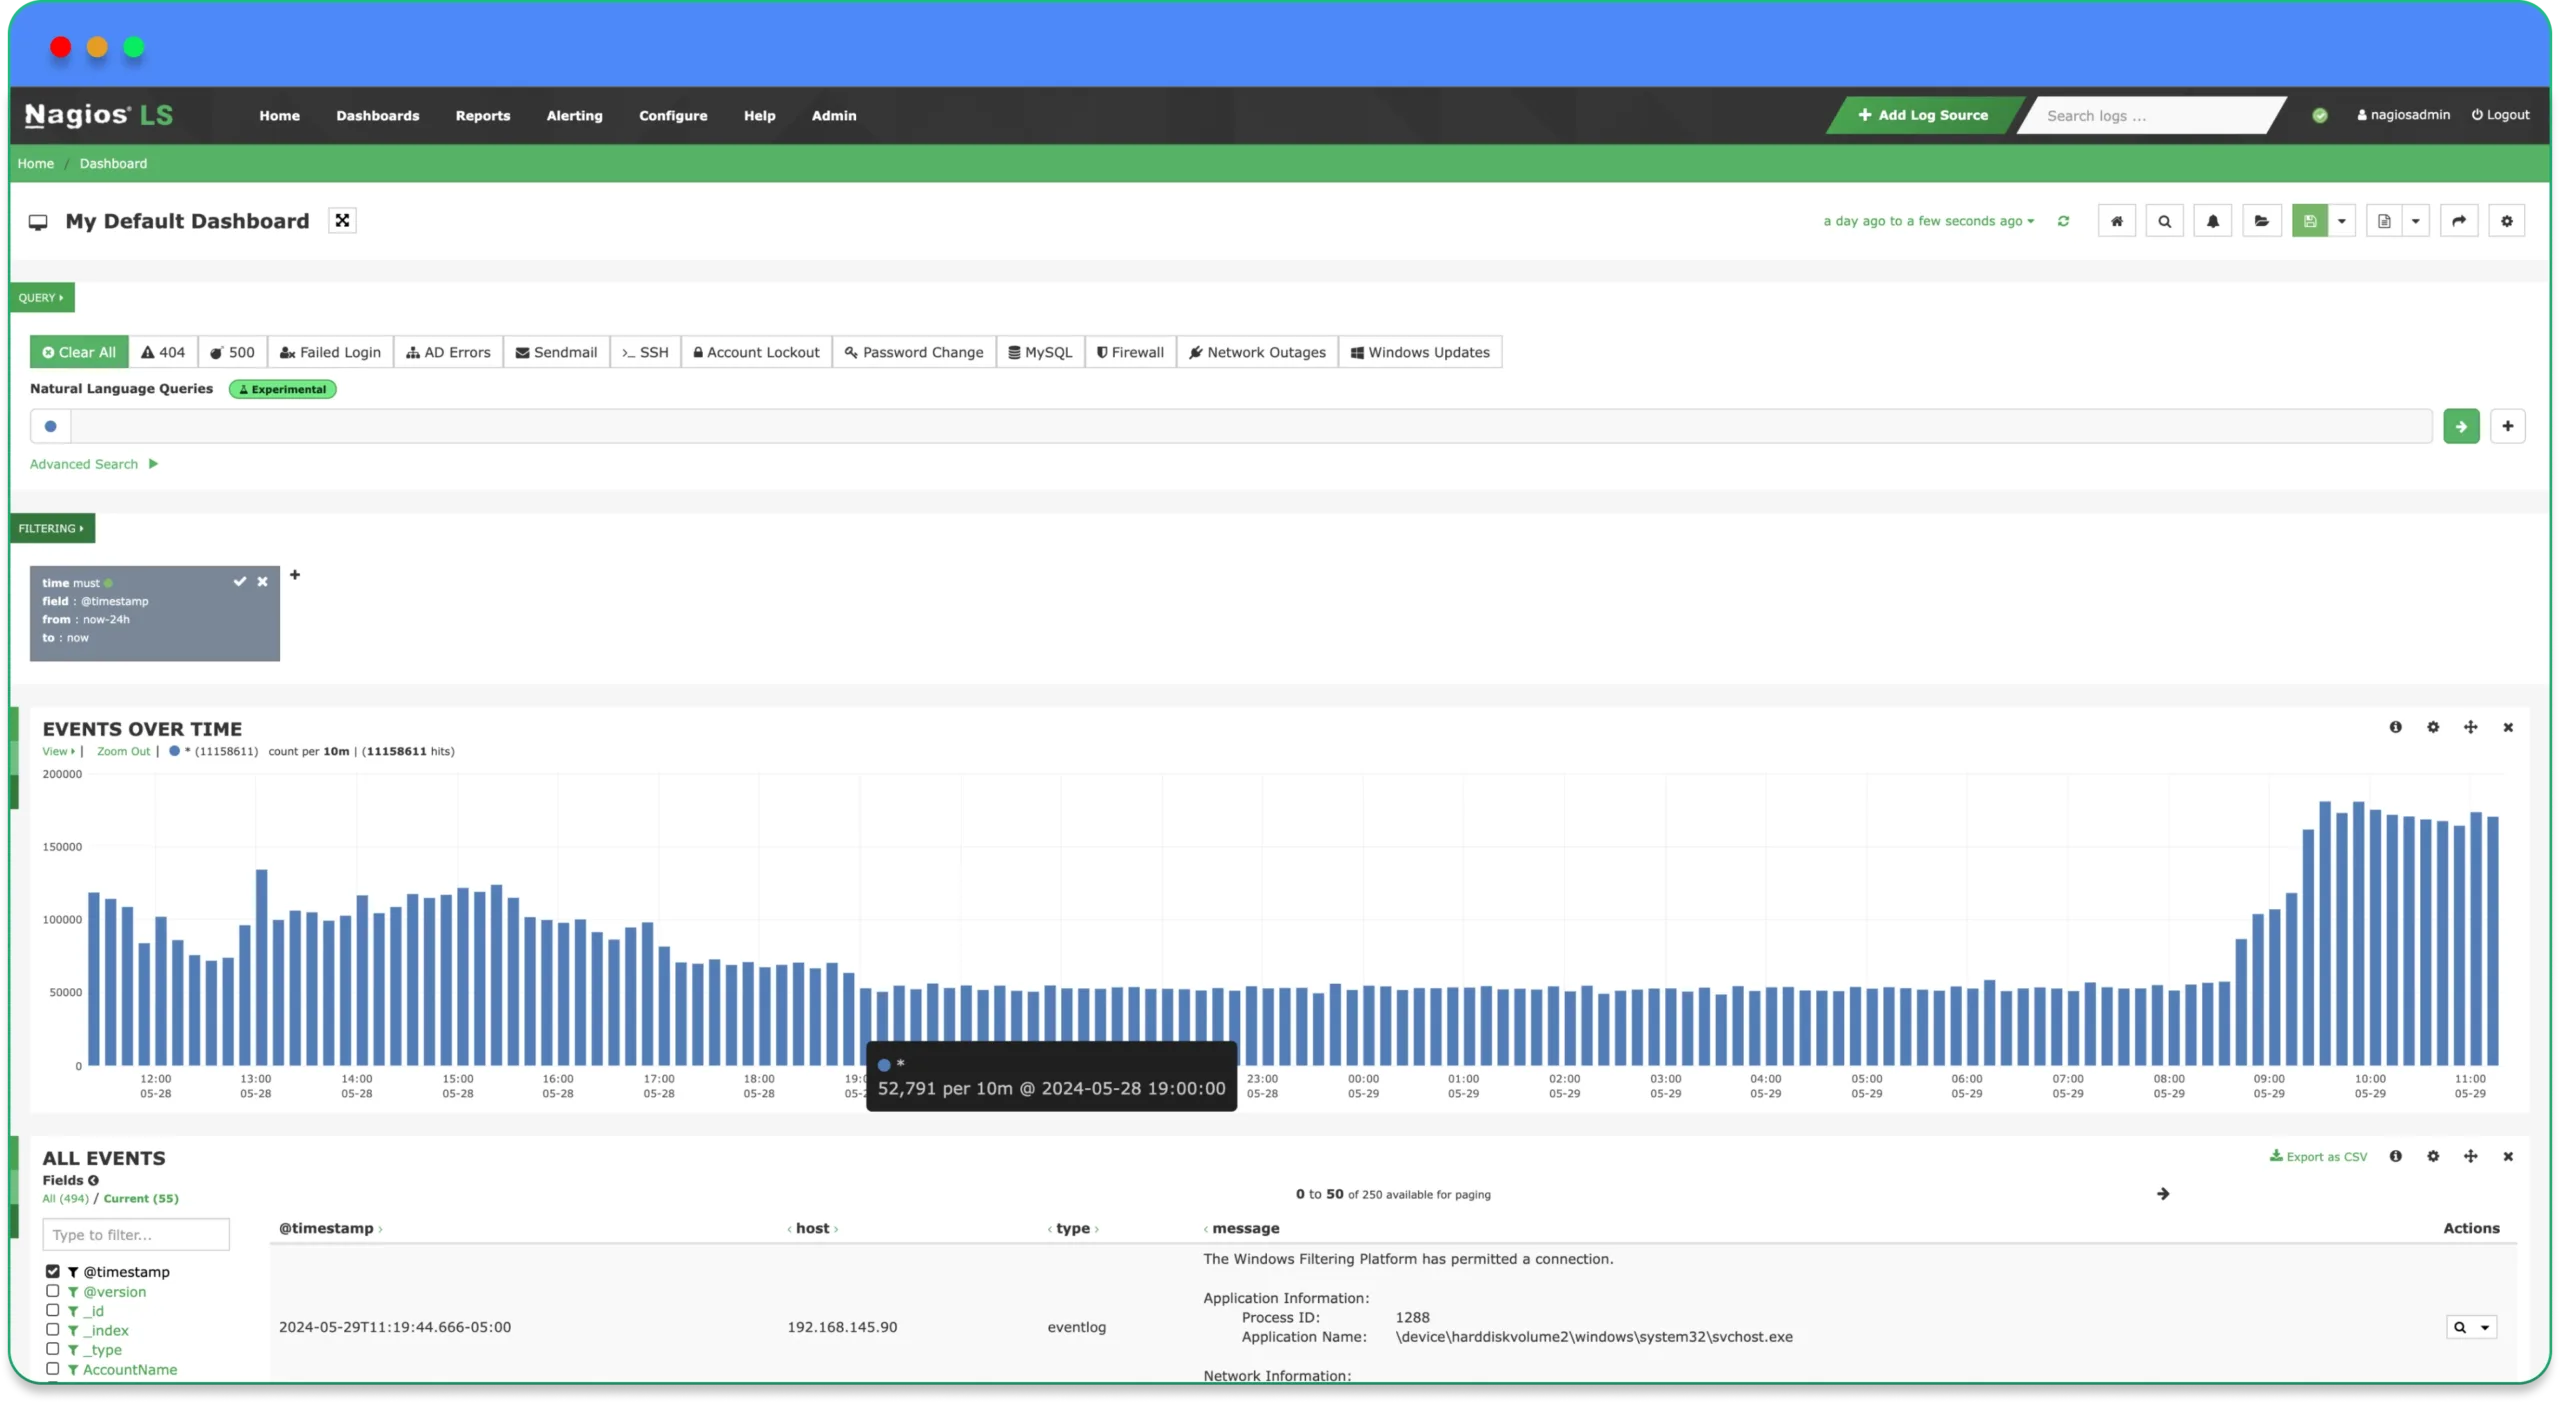
Search with multiple queries and filters allowing you to quickly drill down to the exact problem you are searching for.
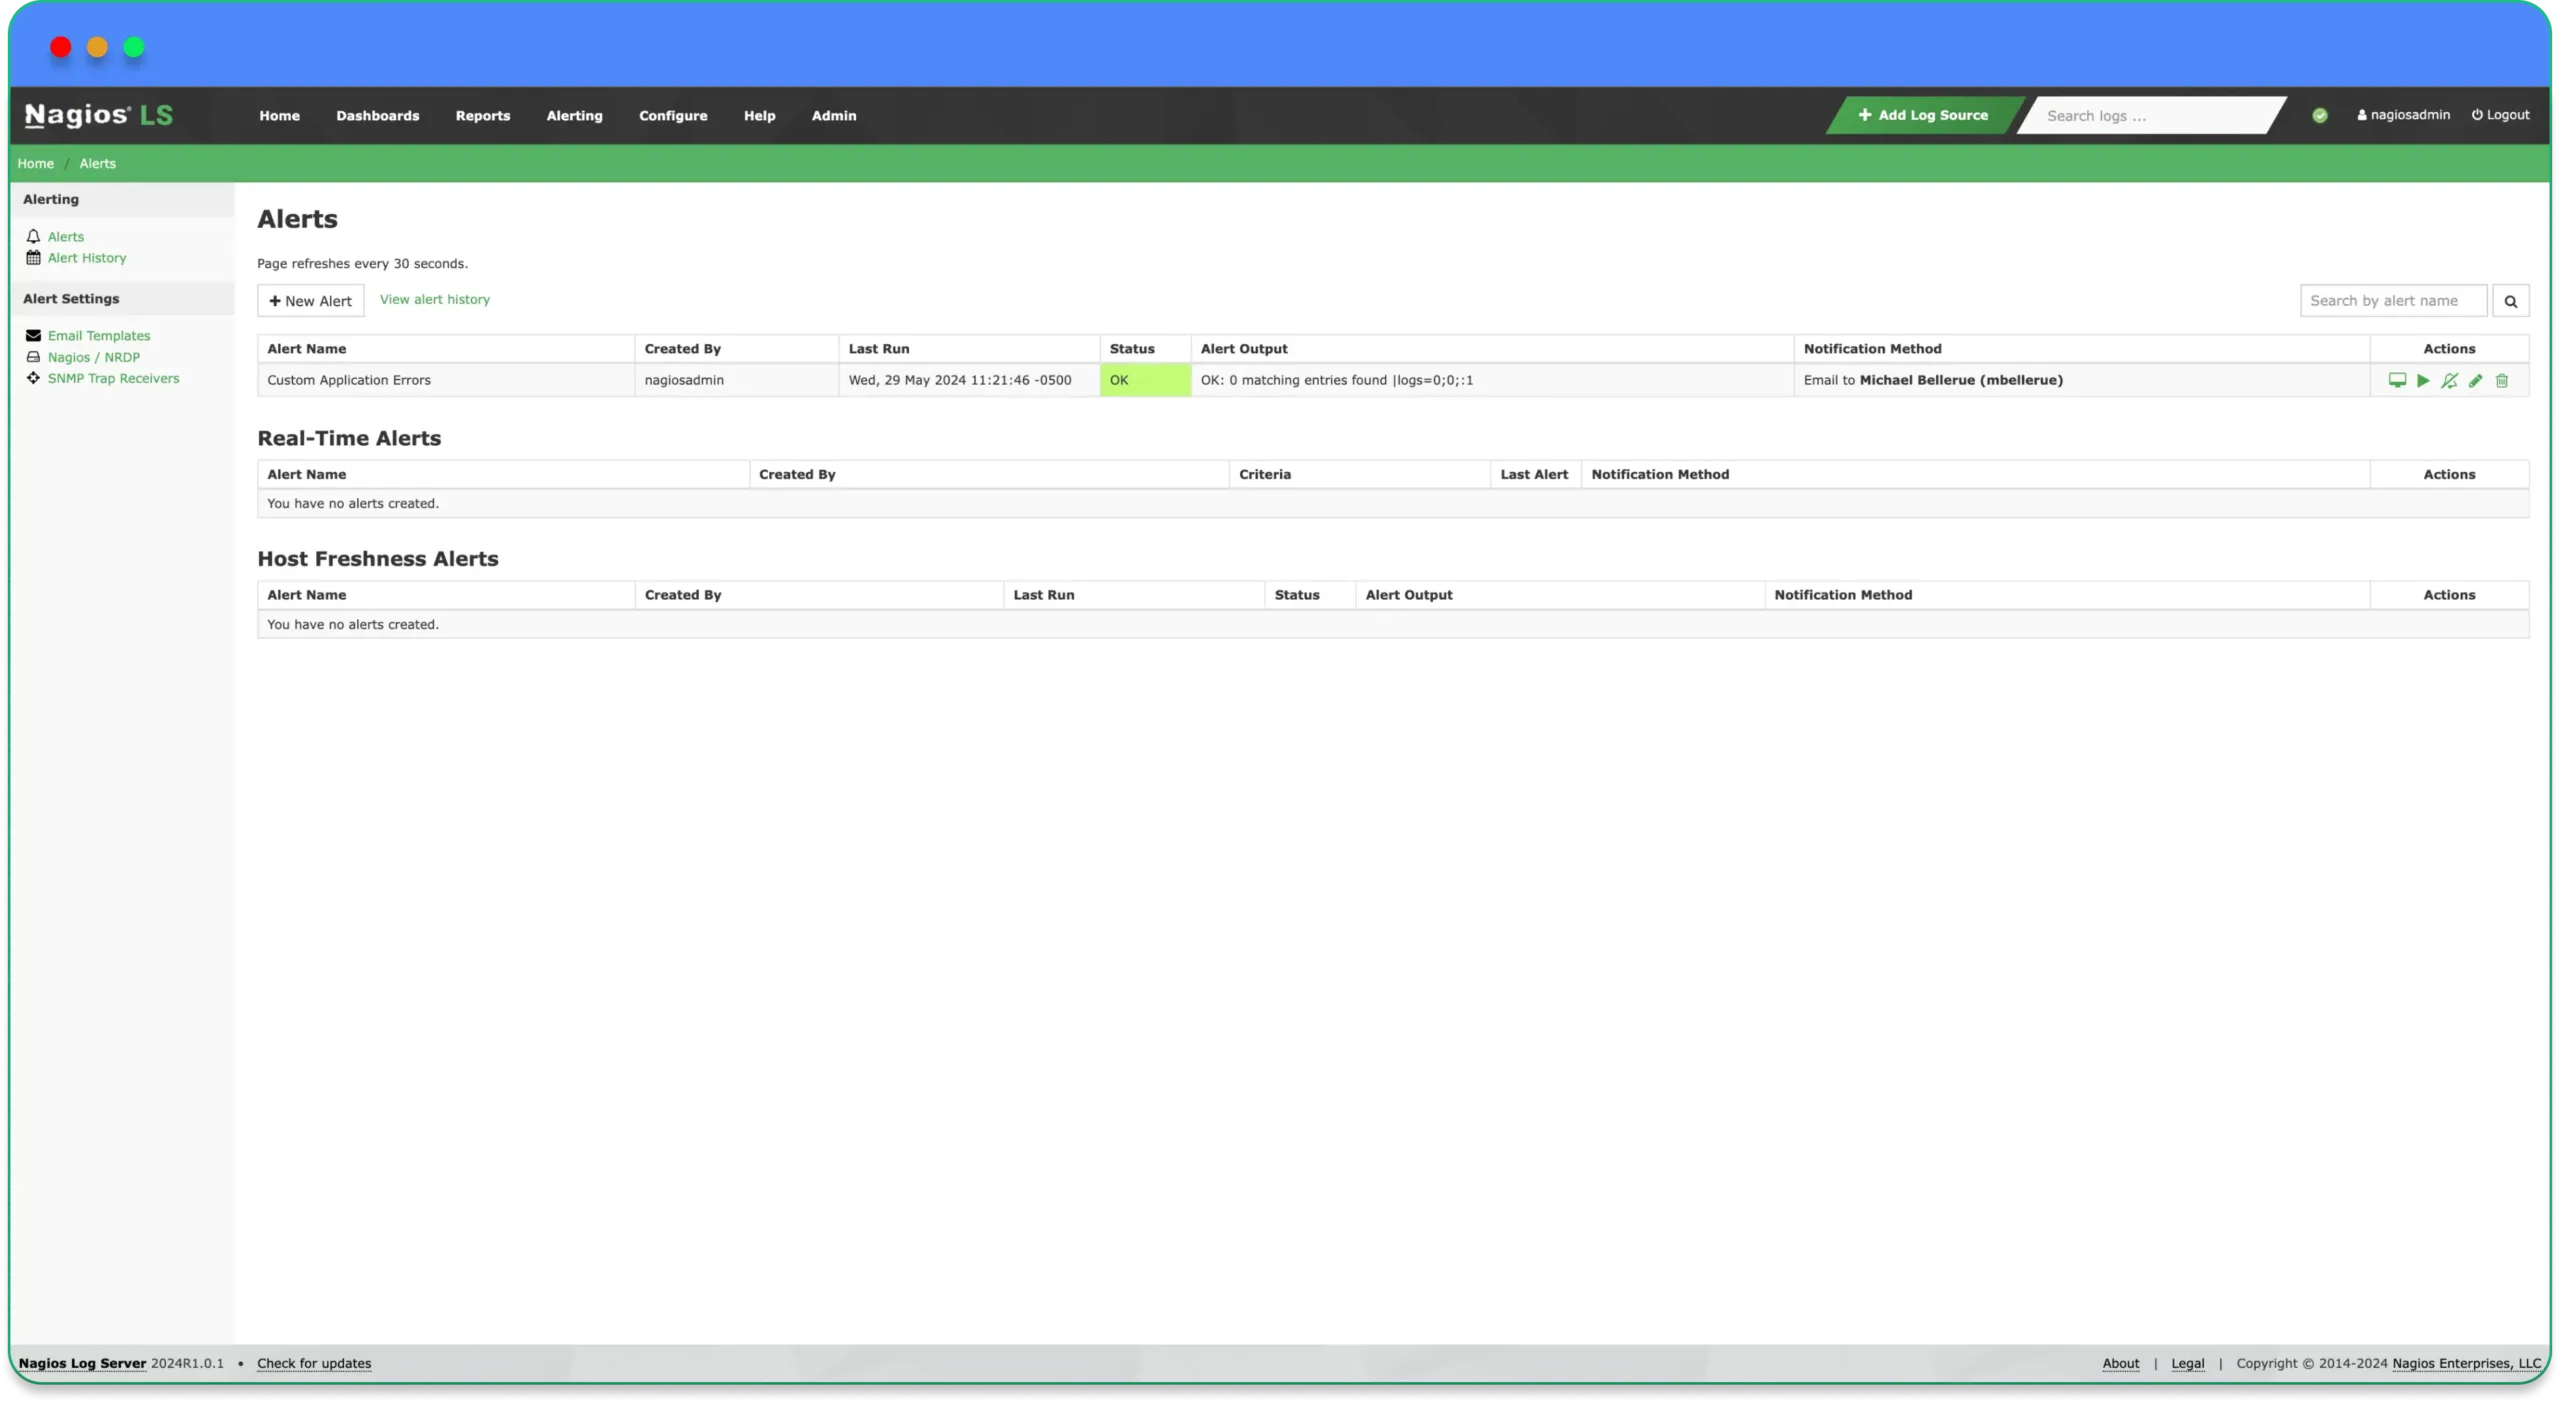
Create alerts based on queries with specific thresholds and send them to proper team members.
See continuous log data from all of your servers , allowing you to analyze and solve problems as they occur.
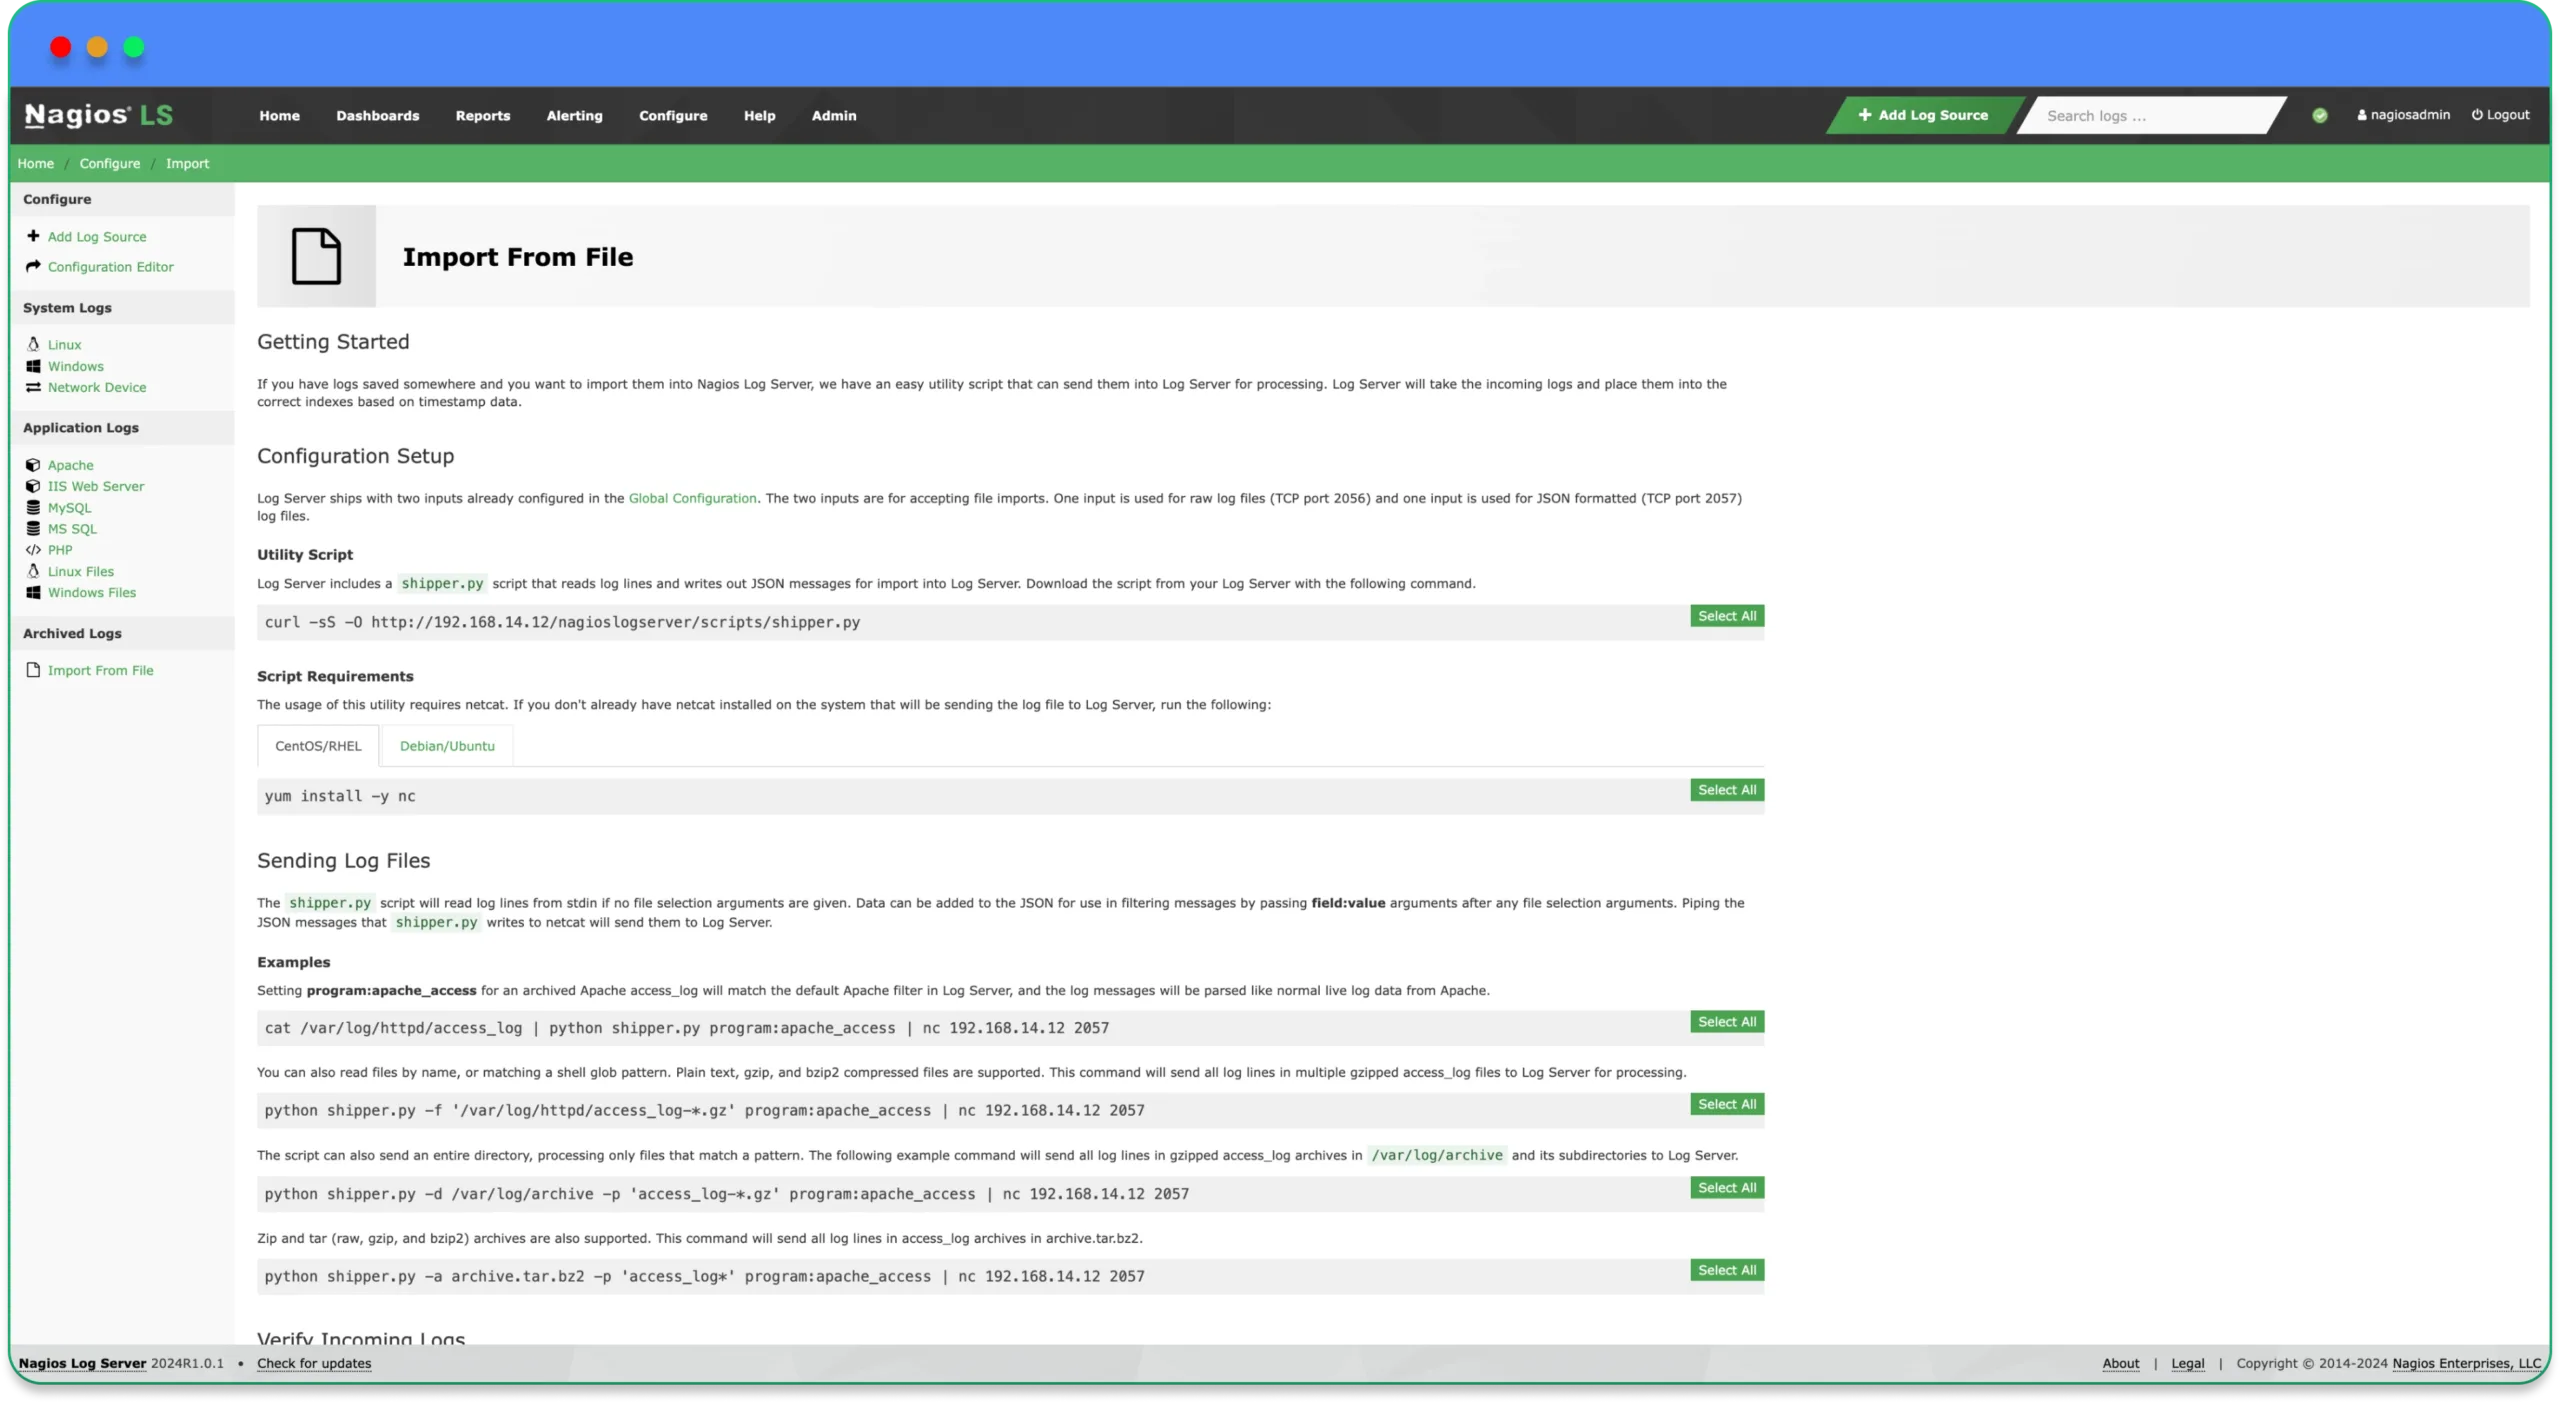
Receive log data from a designated source with just a few clicks using easy to follow step by step instructions.
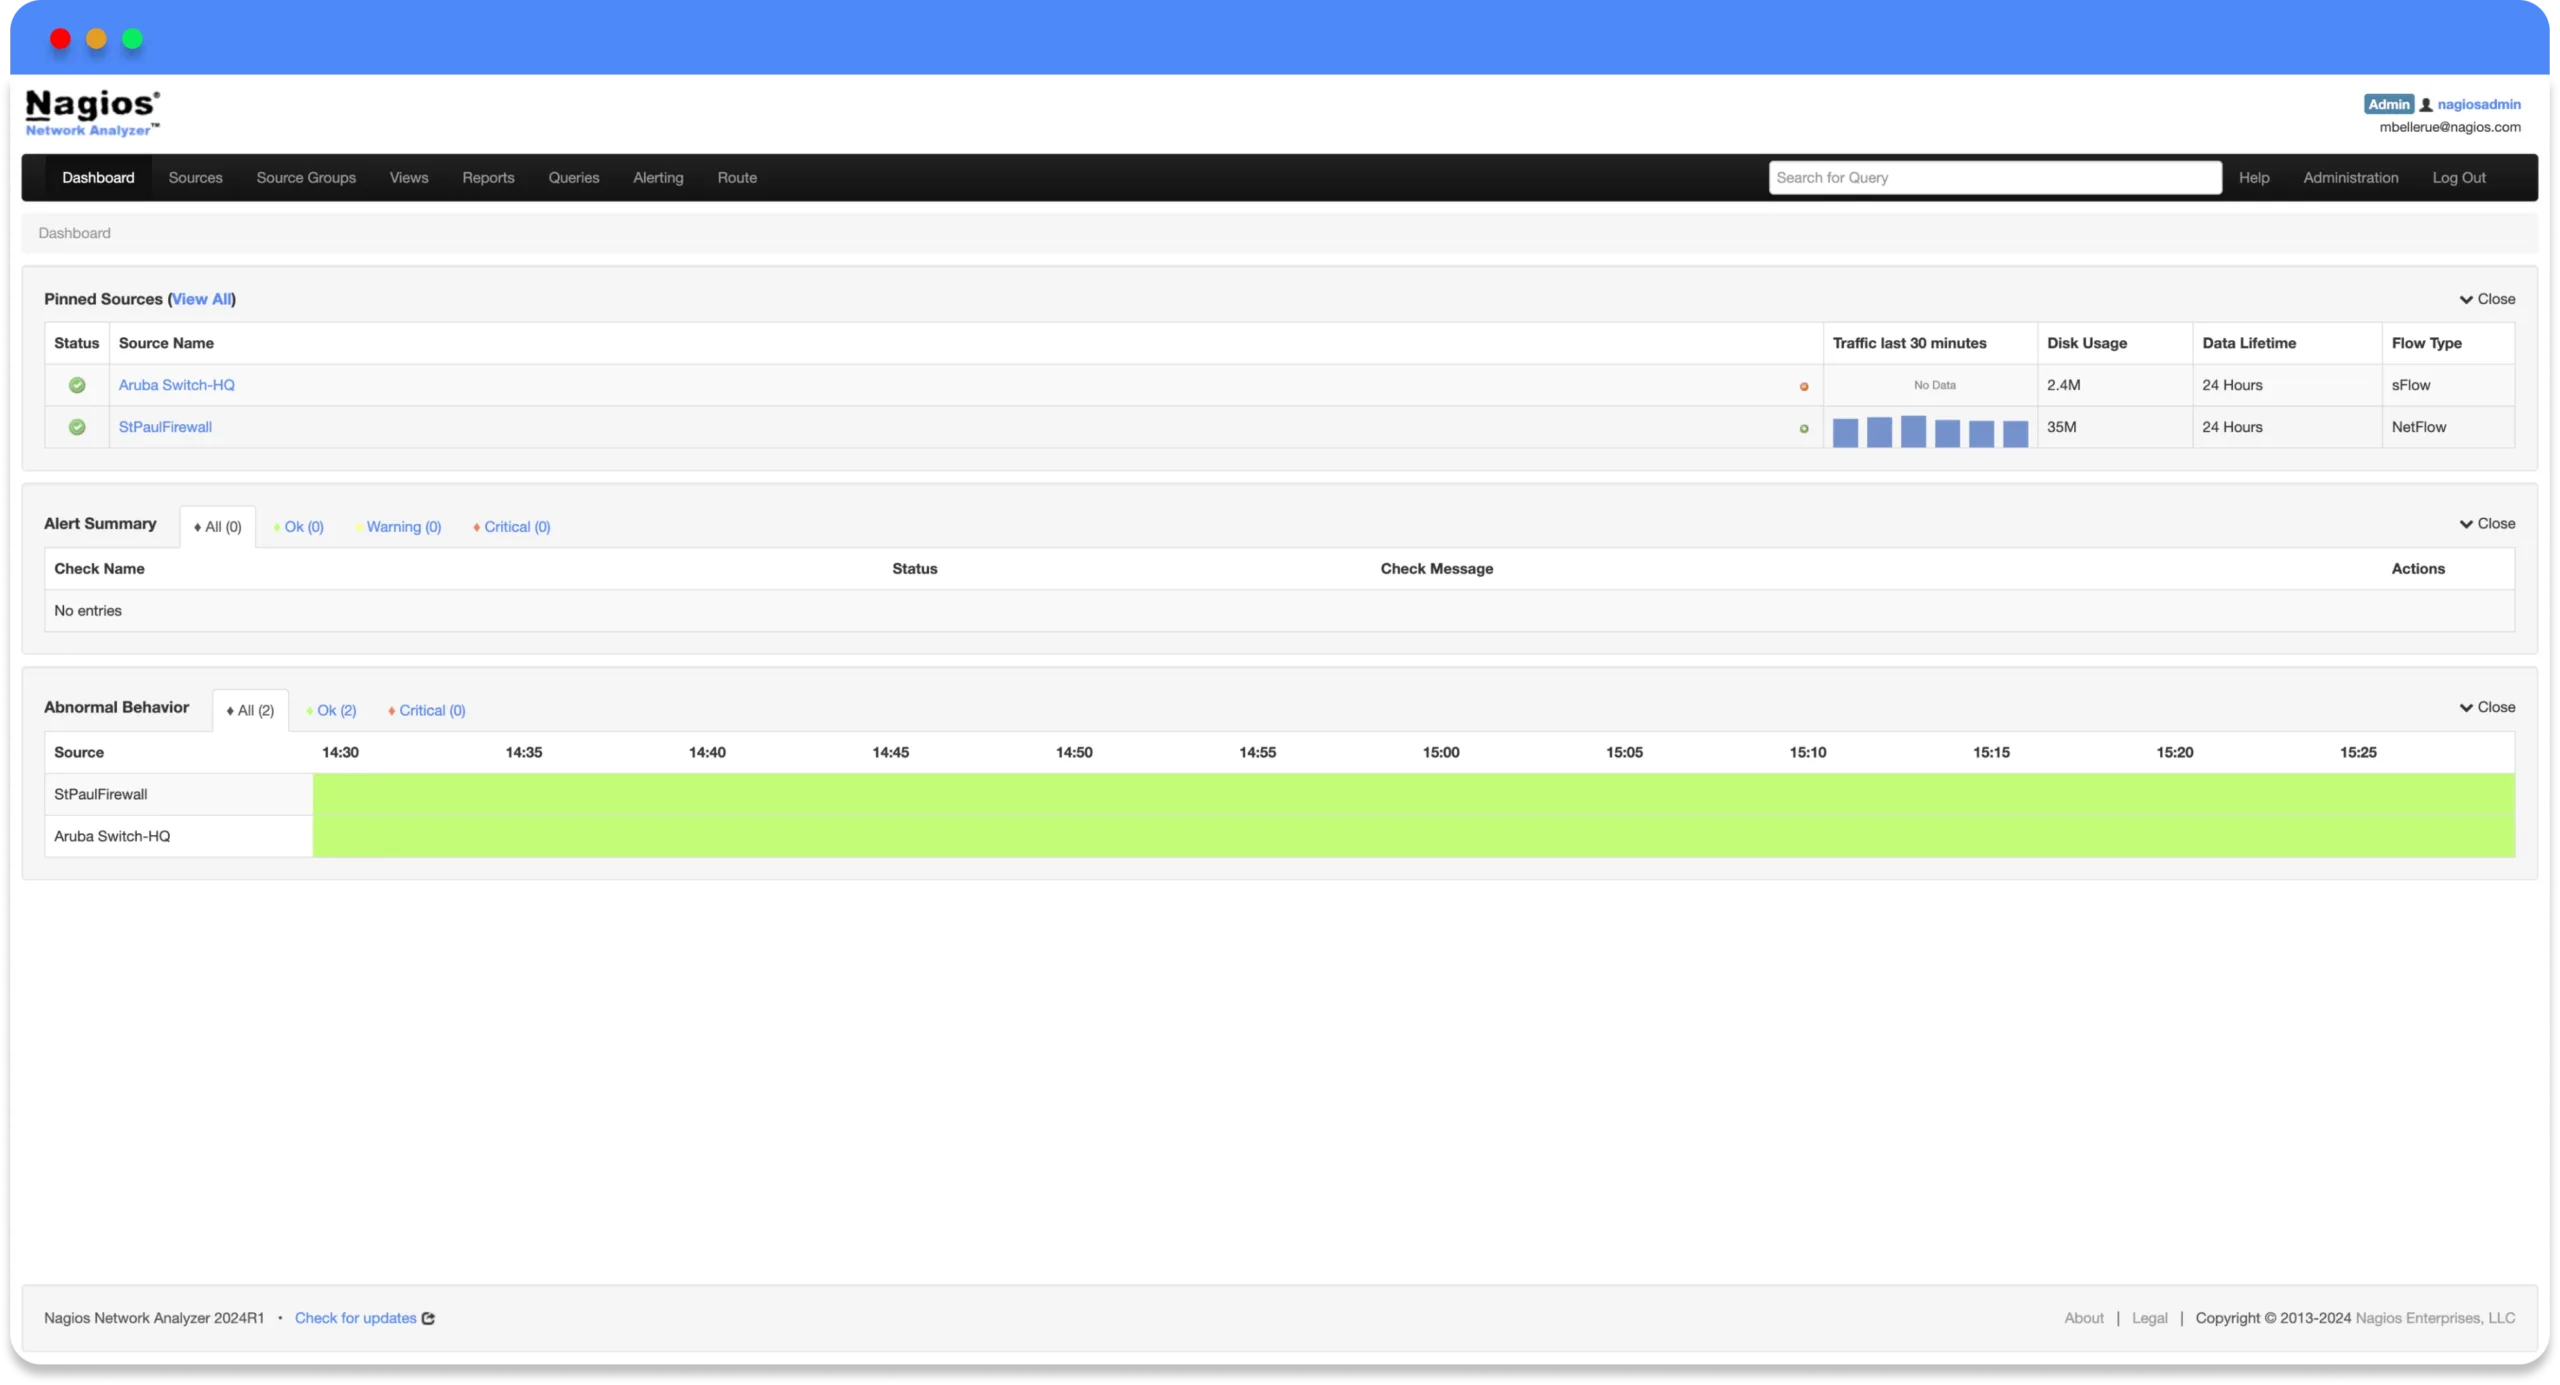
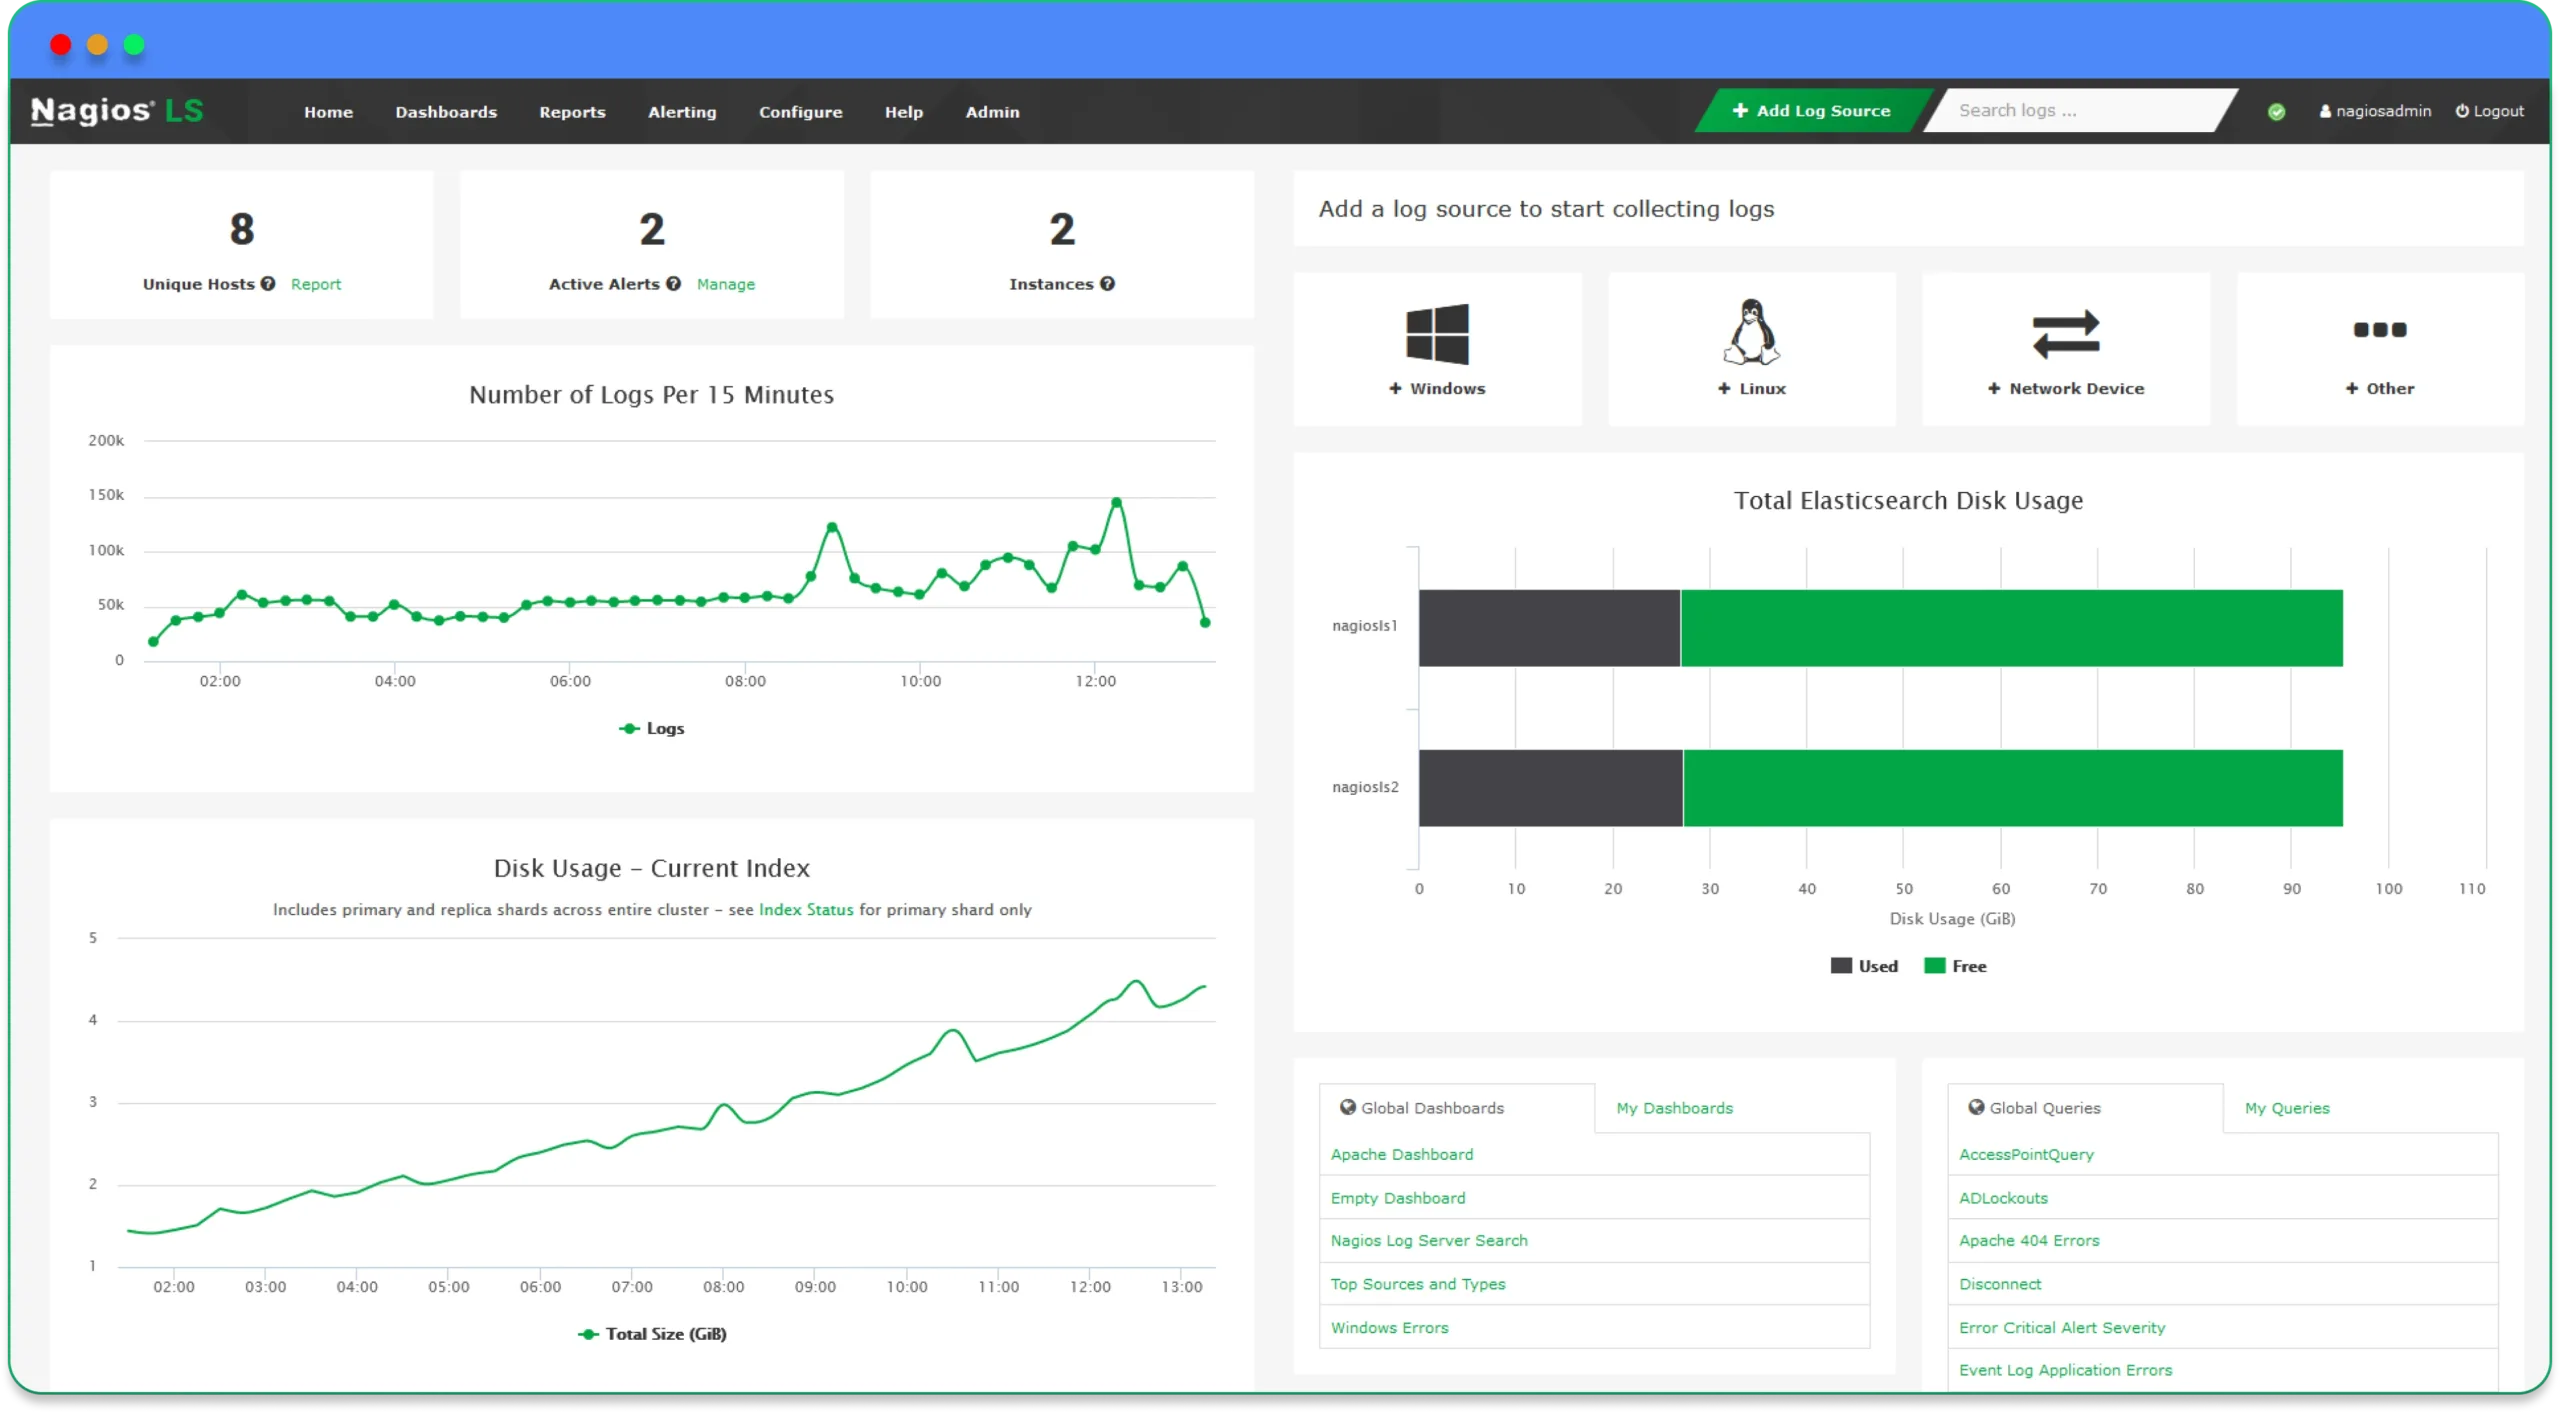
The home dashboard provides a high-level overview of sources, checks, network flow data and much more.
Advanced user options allow IT teams to work together efficiently to keep the network running smoothly.
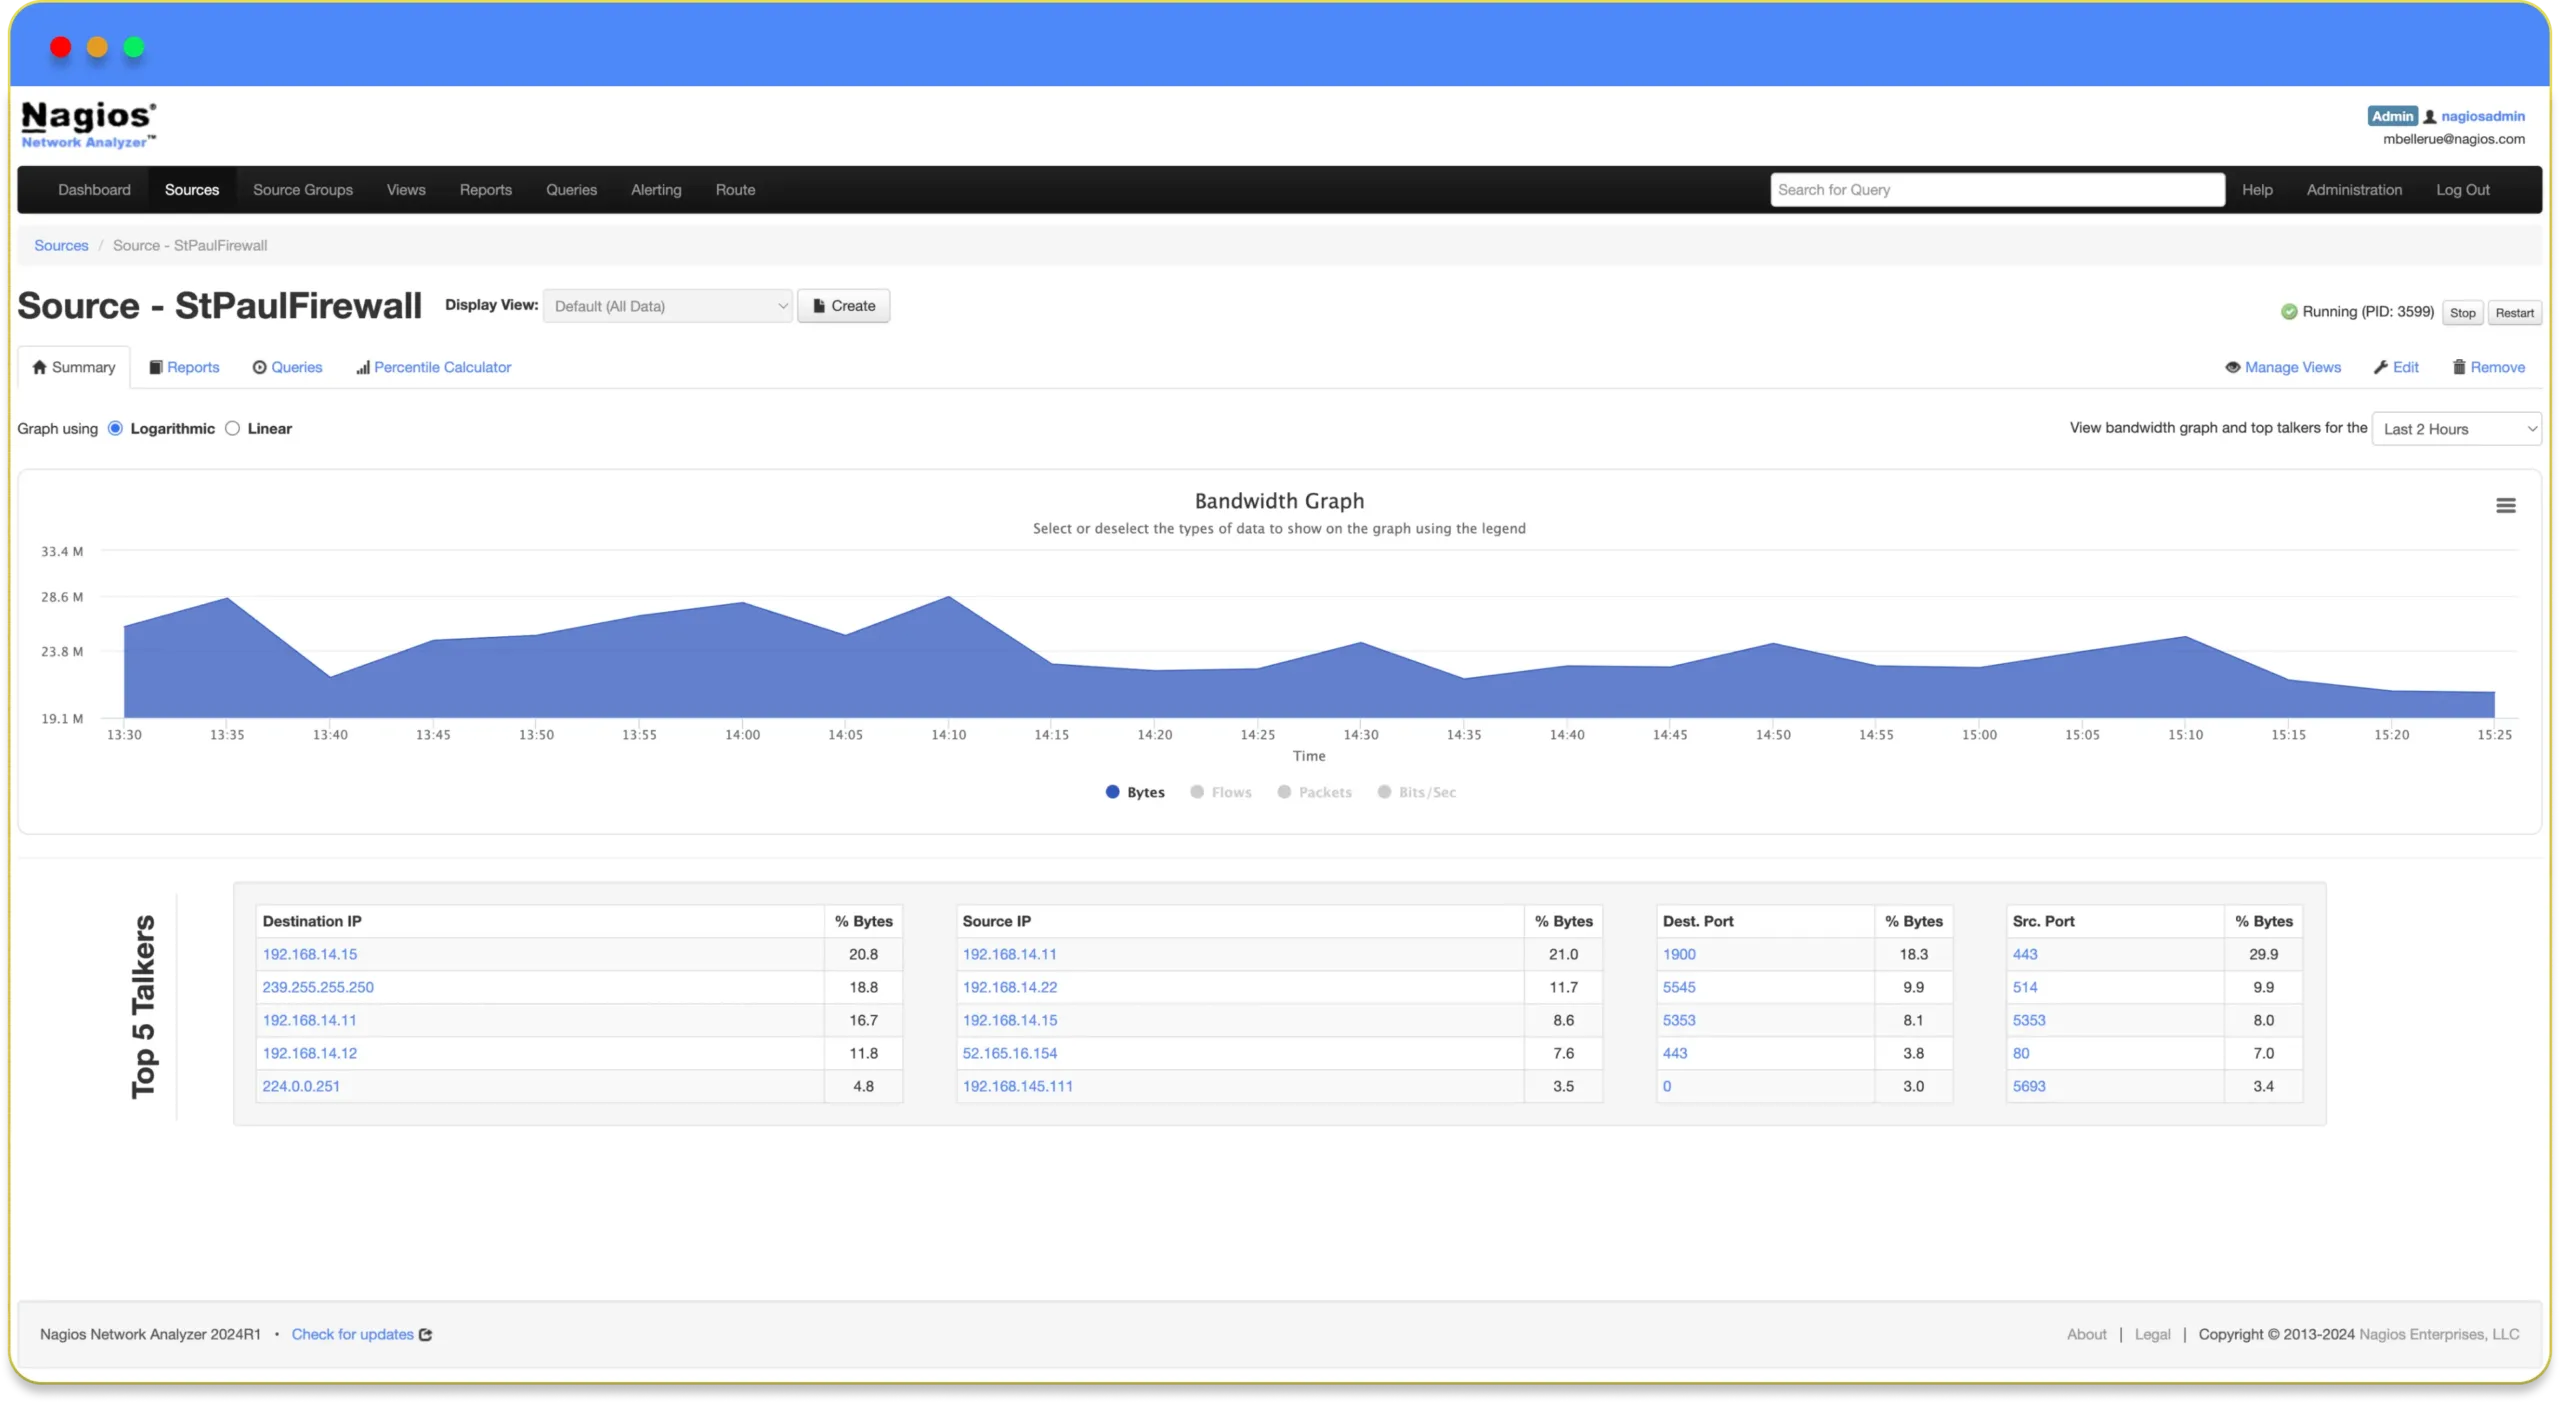
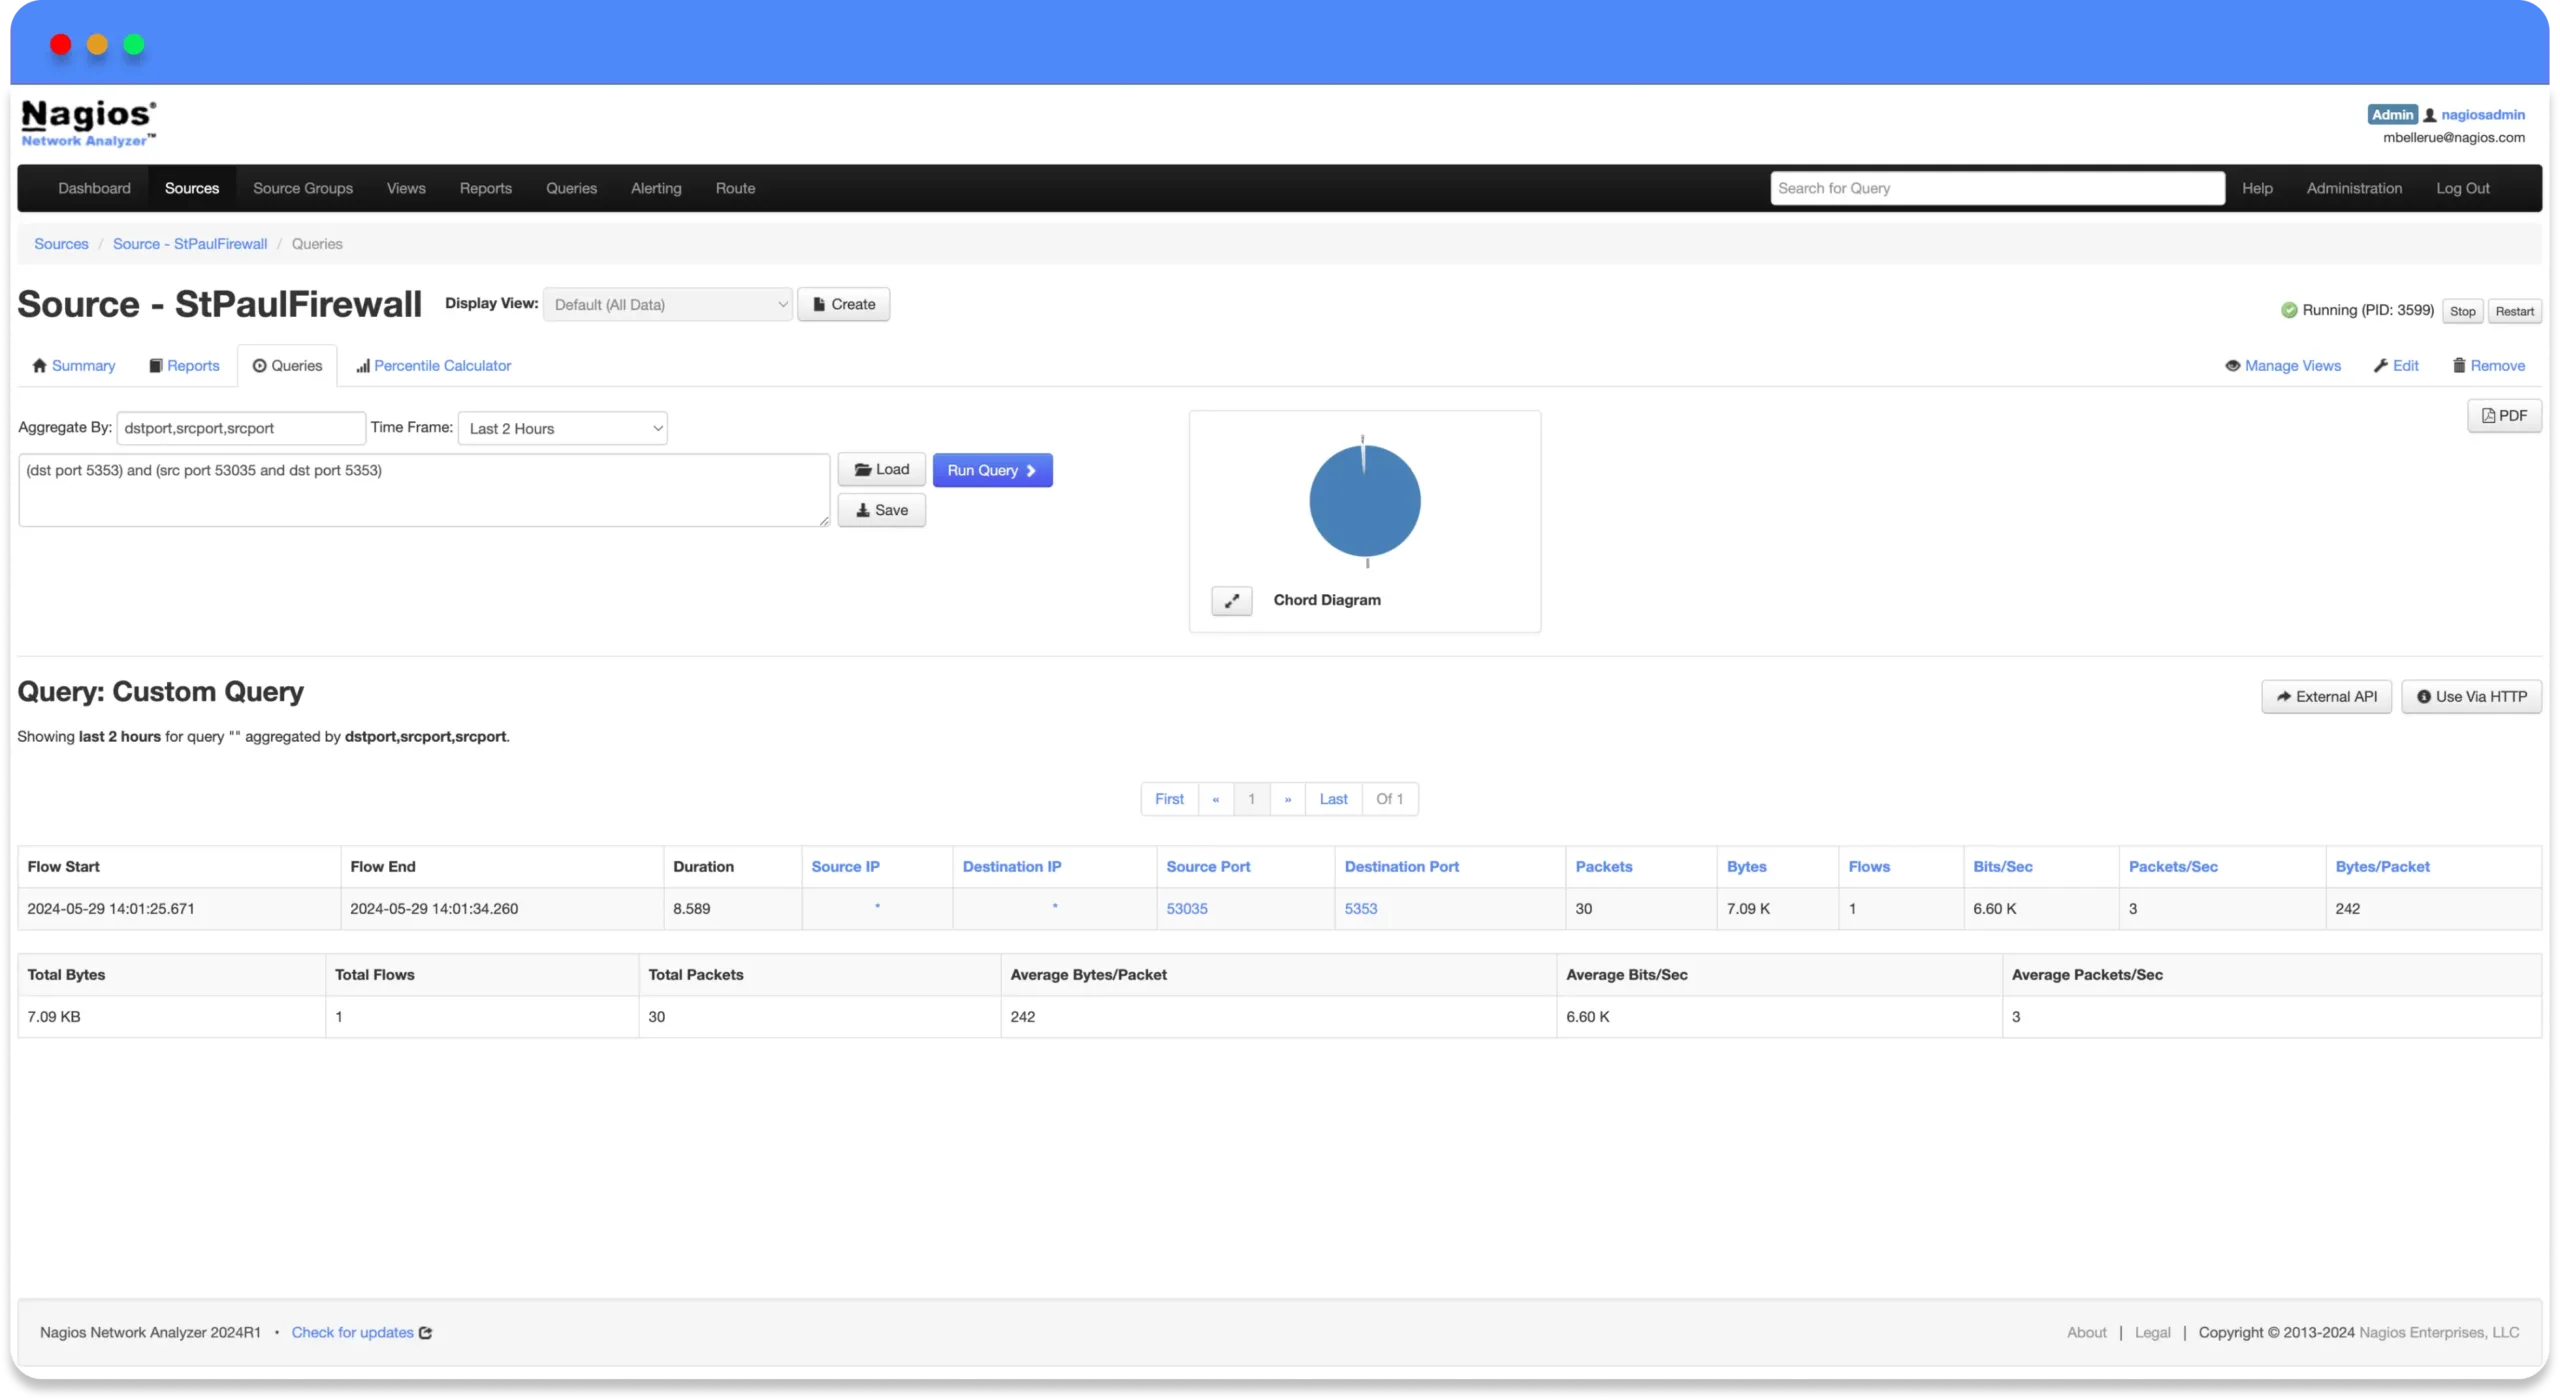
Advanced visualizations provide quick, in-depth insights on network traffic, bandwidth, and overall network health.
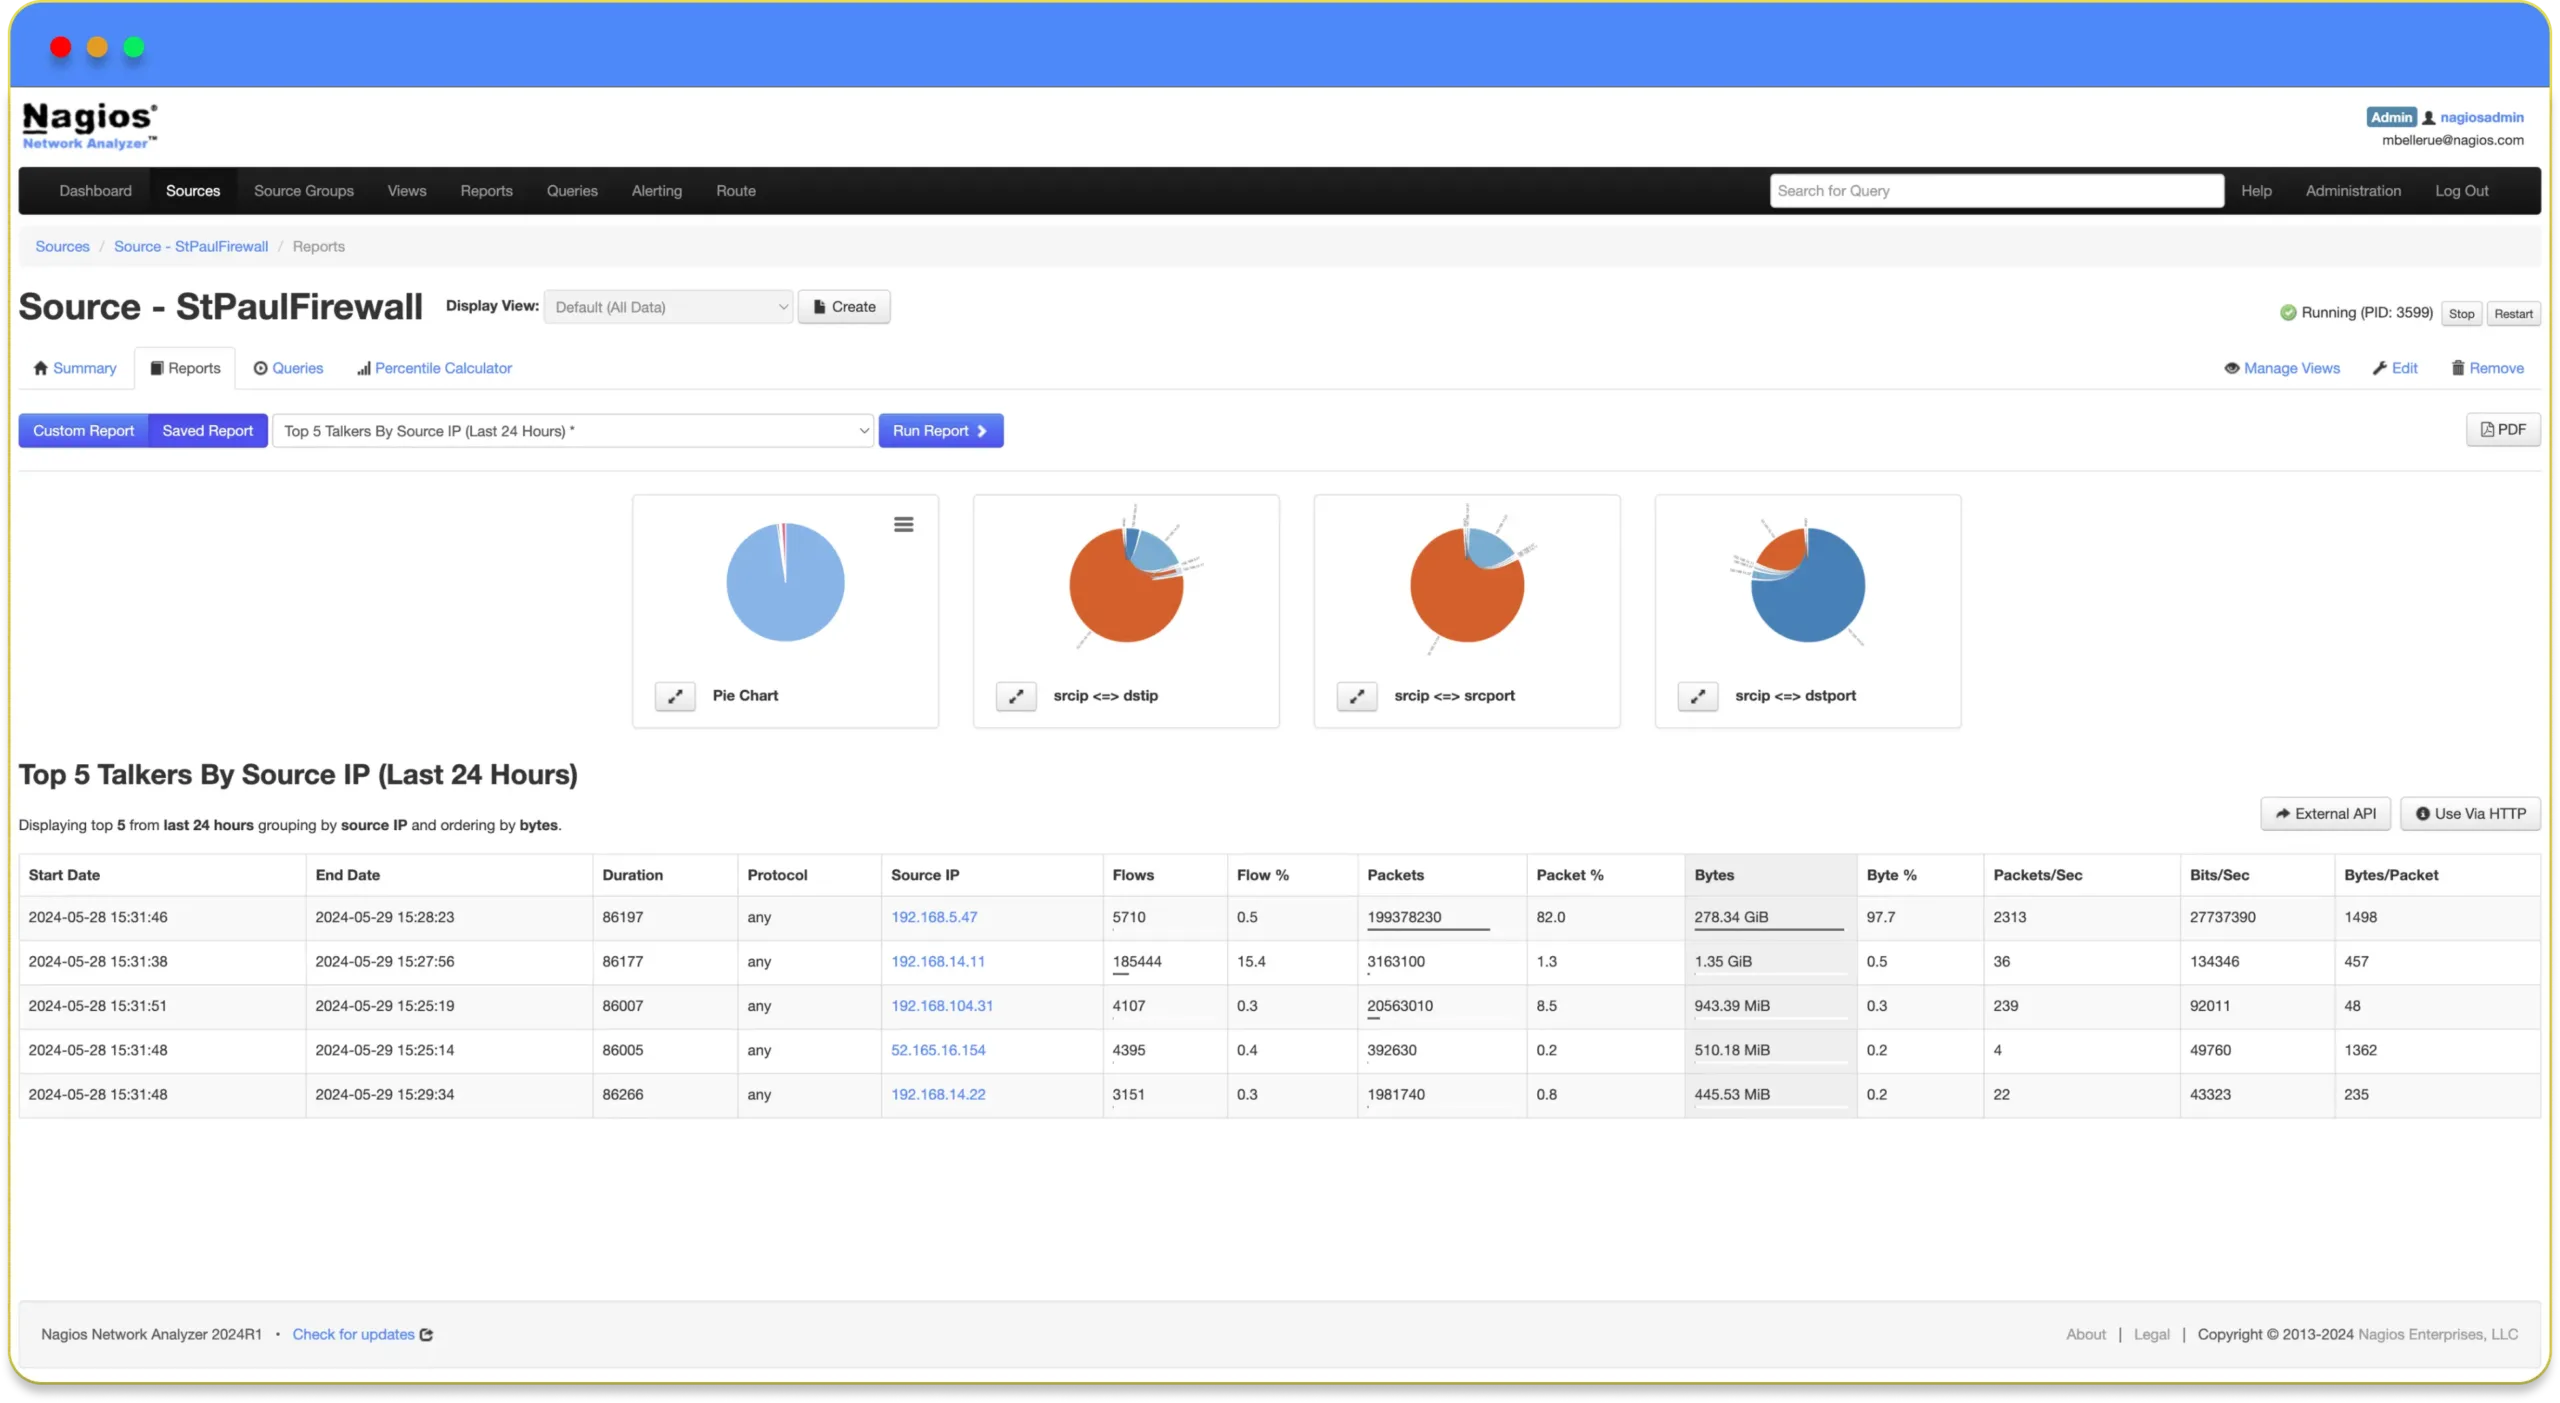
Individualized queries, views, and reports give you the ability to monitor network usage of specific applications.
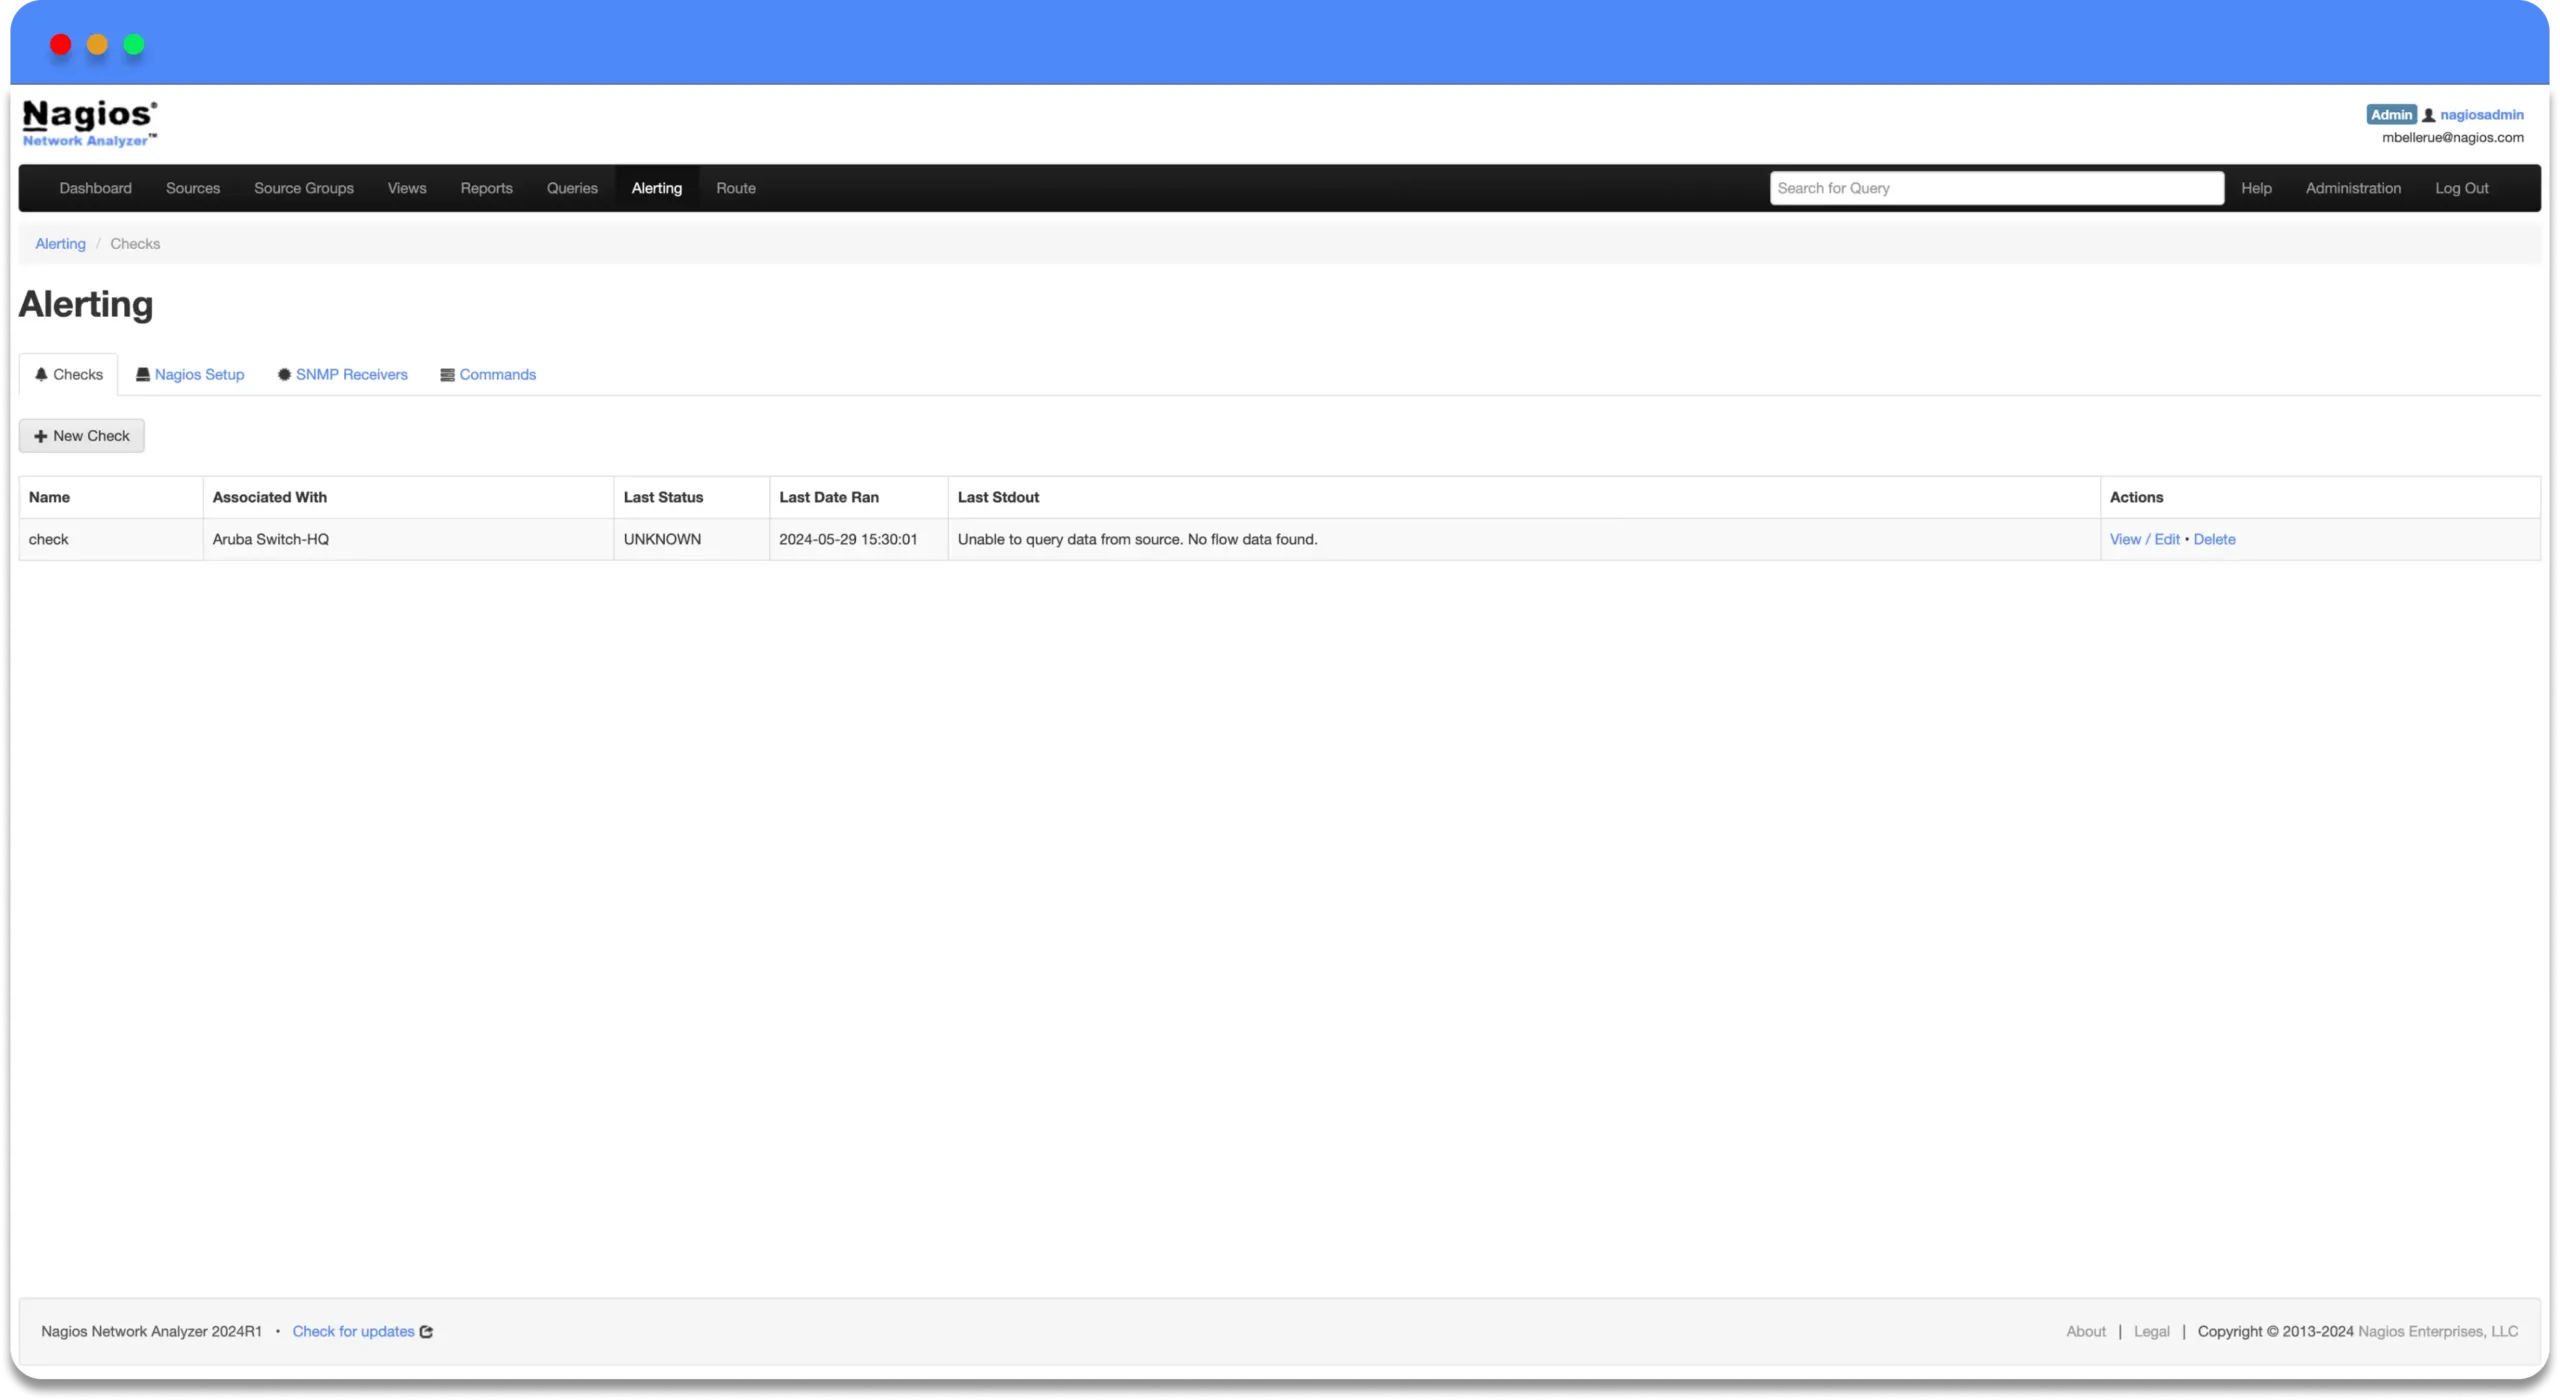
Receive alerts when abnormal activity takes place, or when bandwidth usage exceeds your specified thresholds.
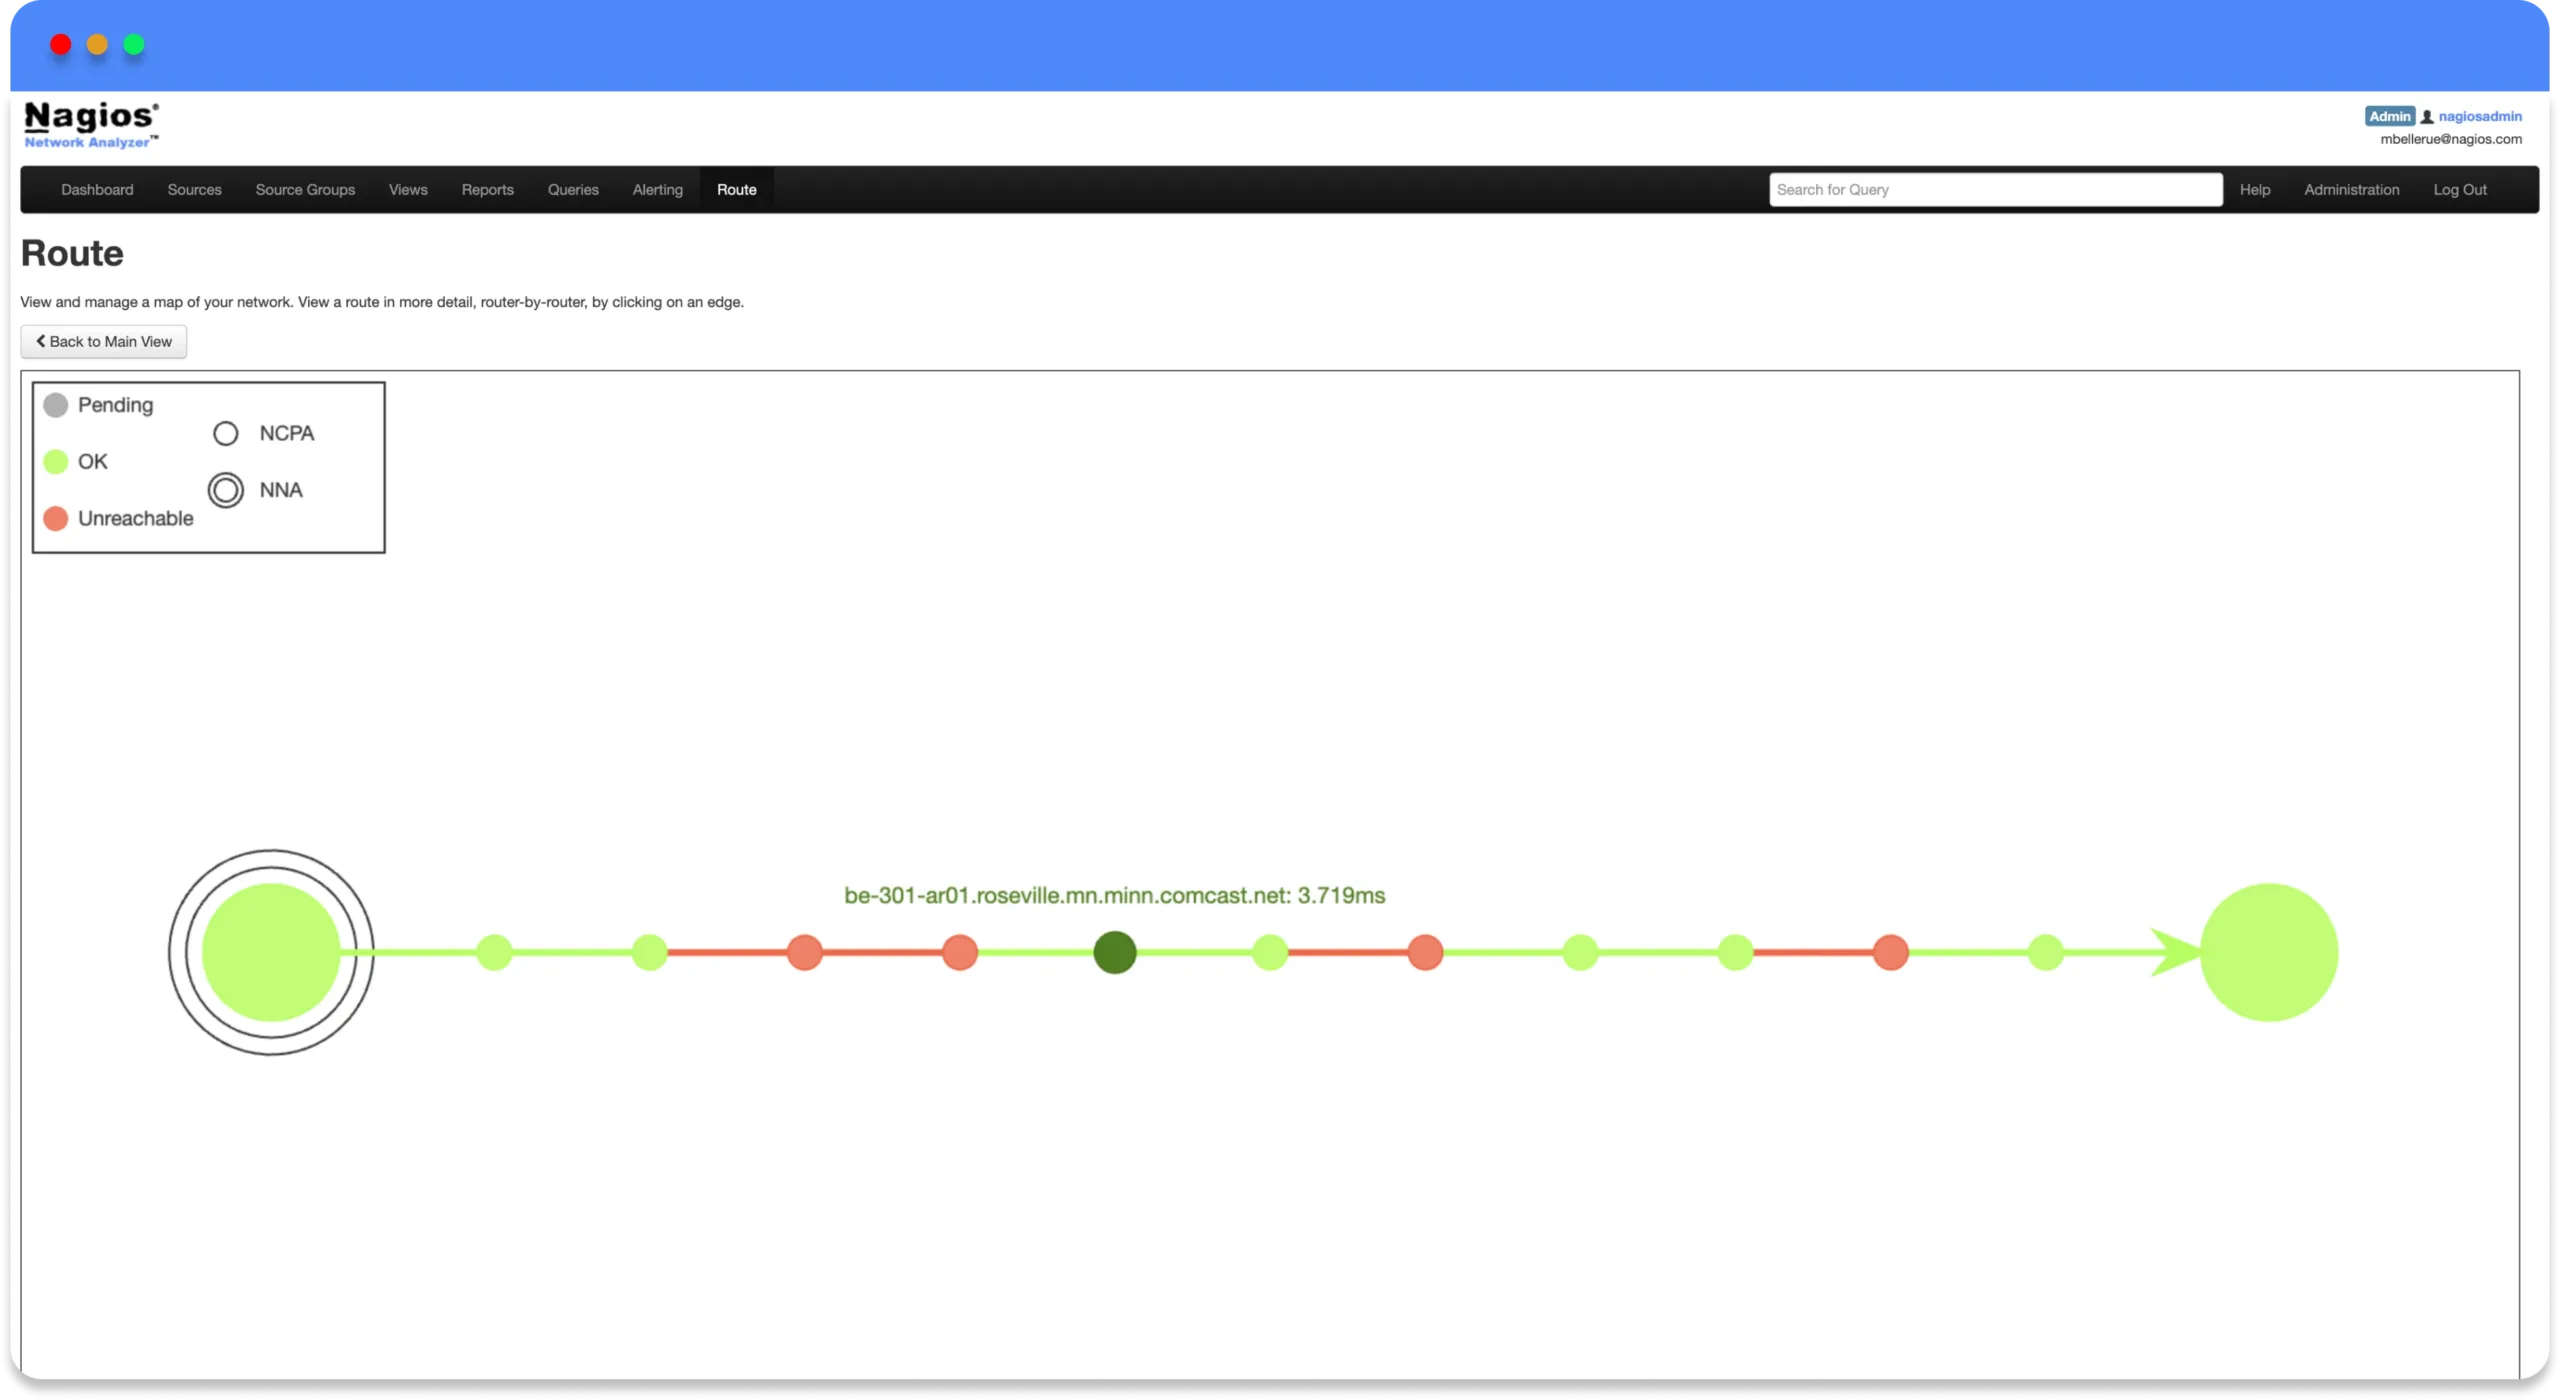
Keep track of specific subsets of network flow information and maintain historical network flow data.
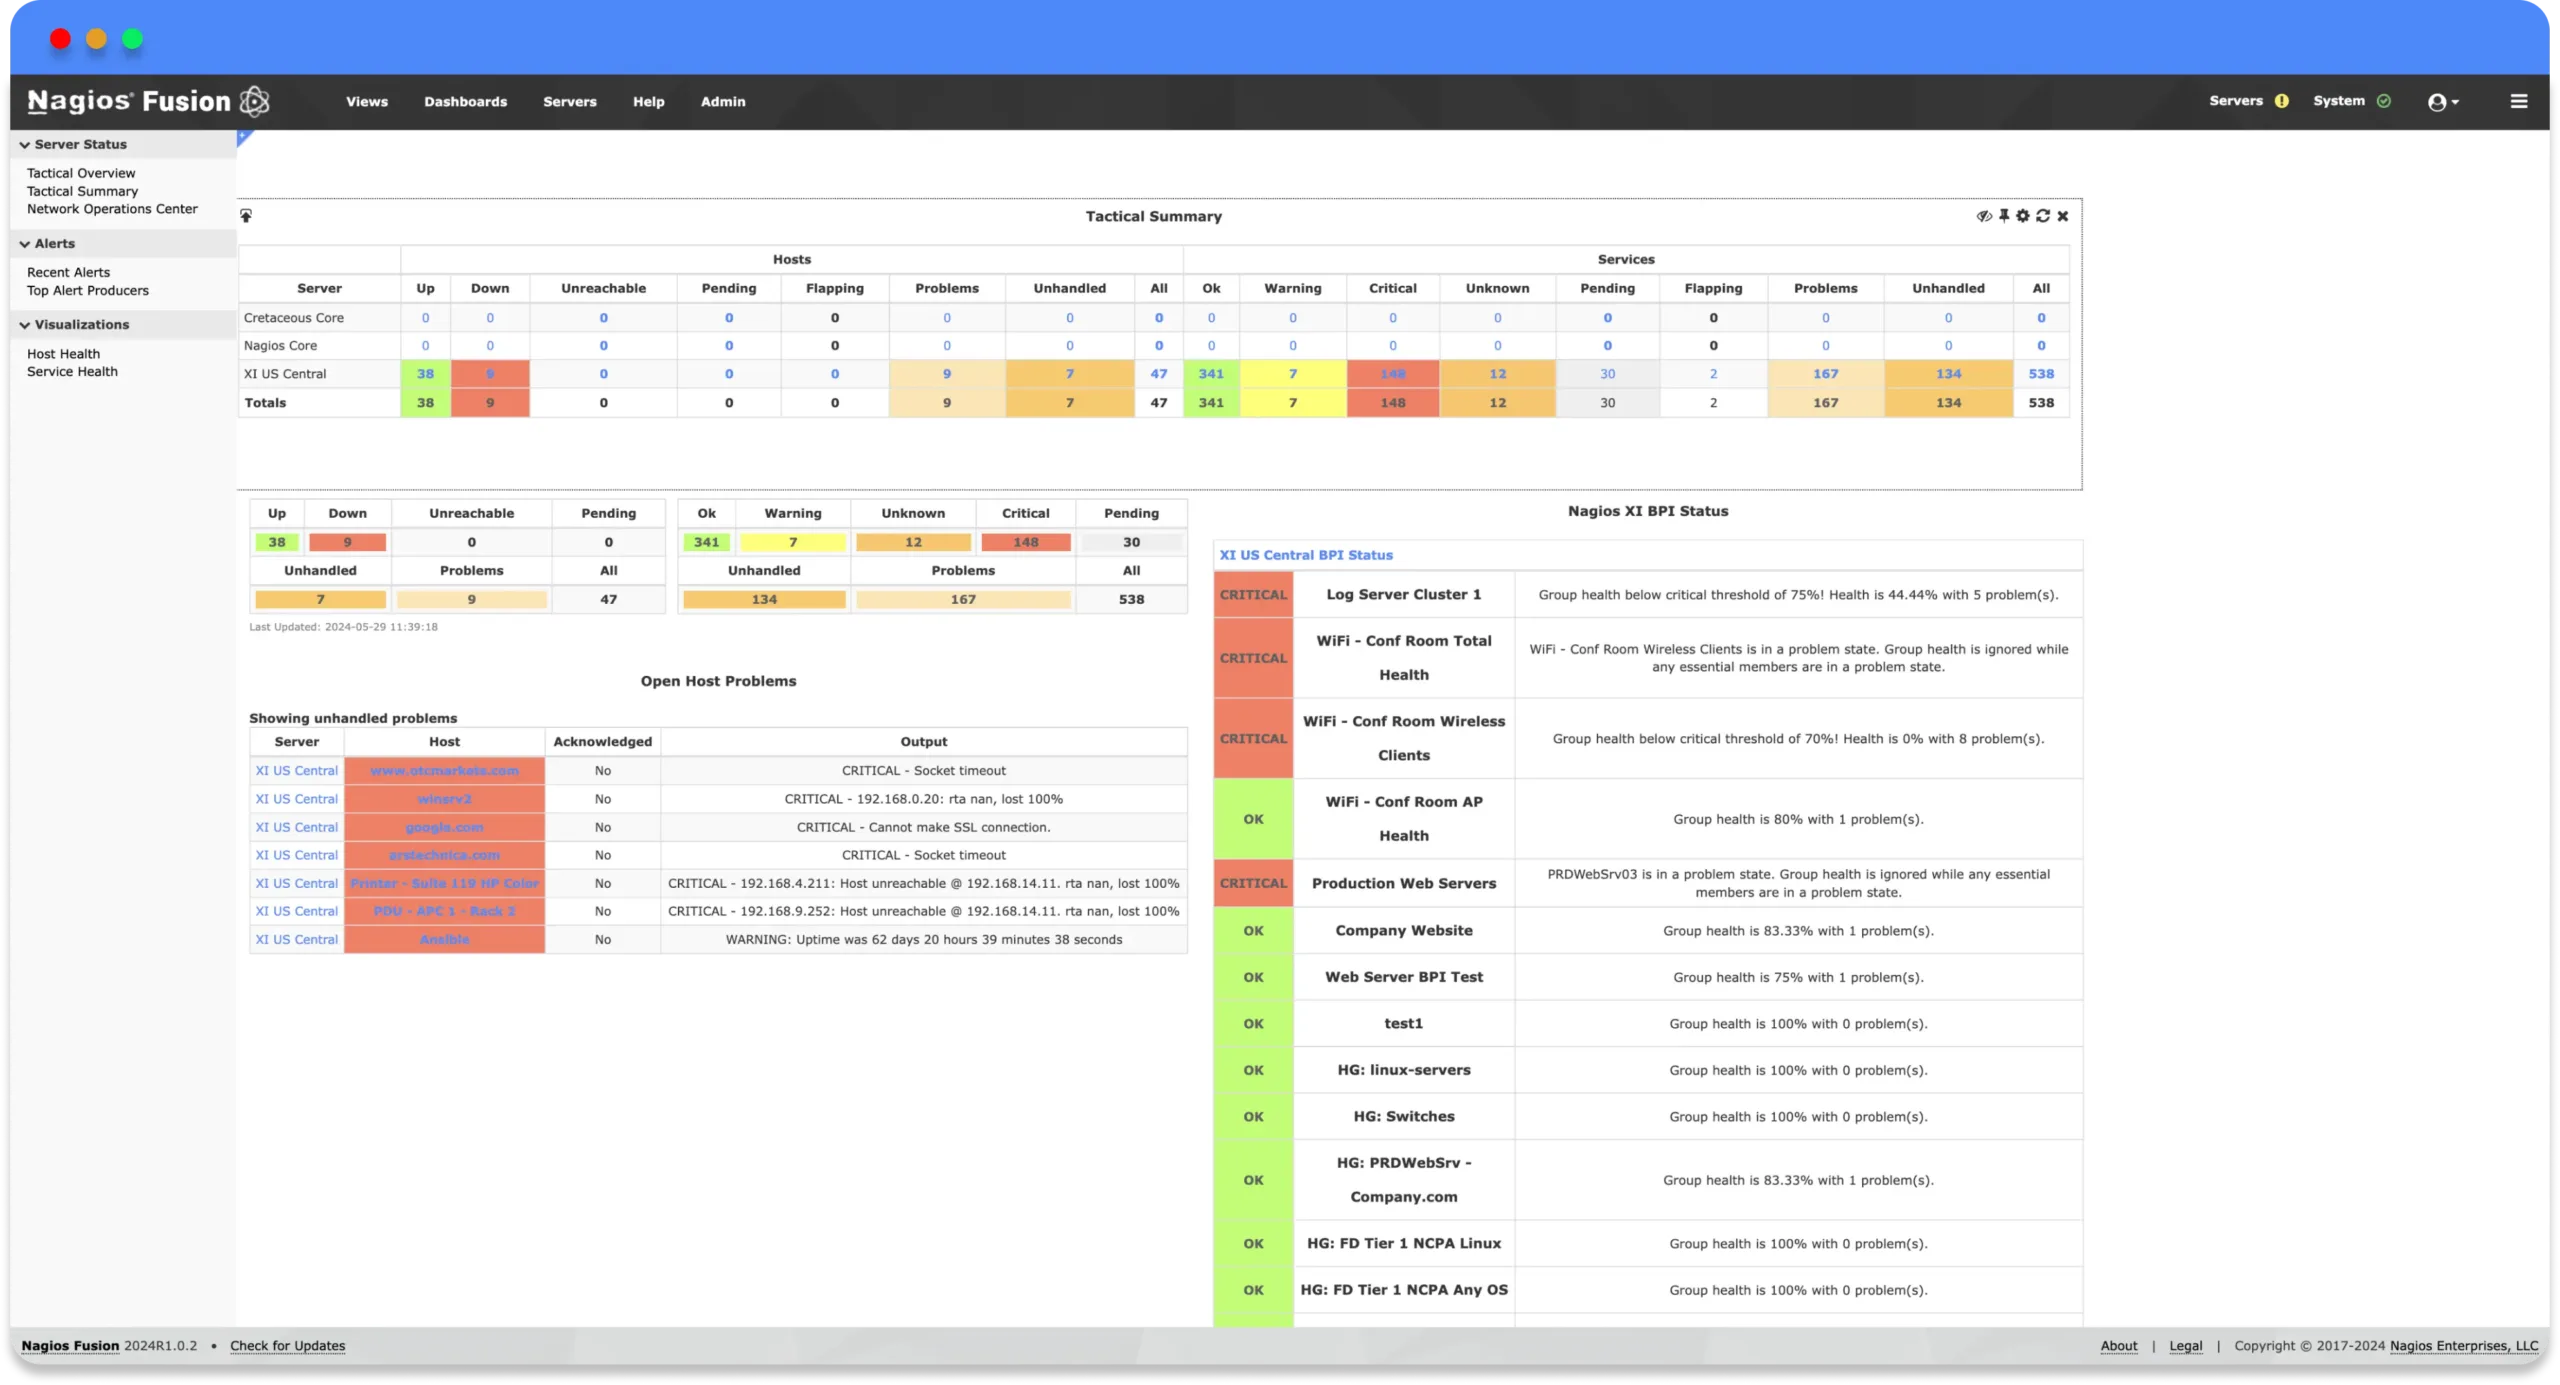
Get a high-level overview of your distributed environments and gain insight into the health of your network.
Sysadmins have the ability to centrally manage their monitoring servers regardless of geographical location.
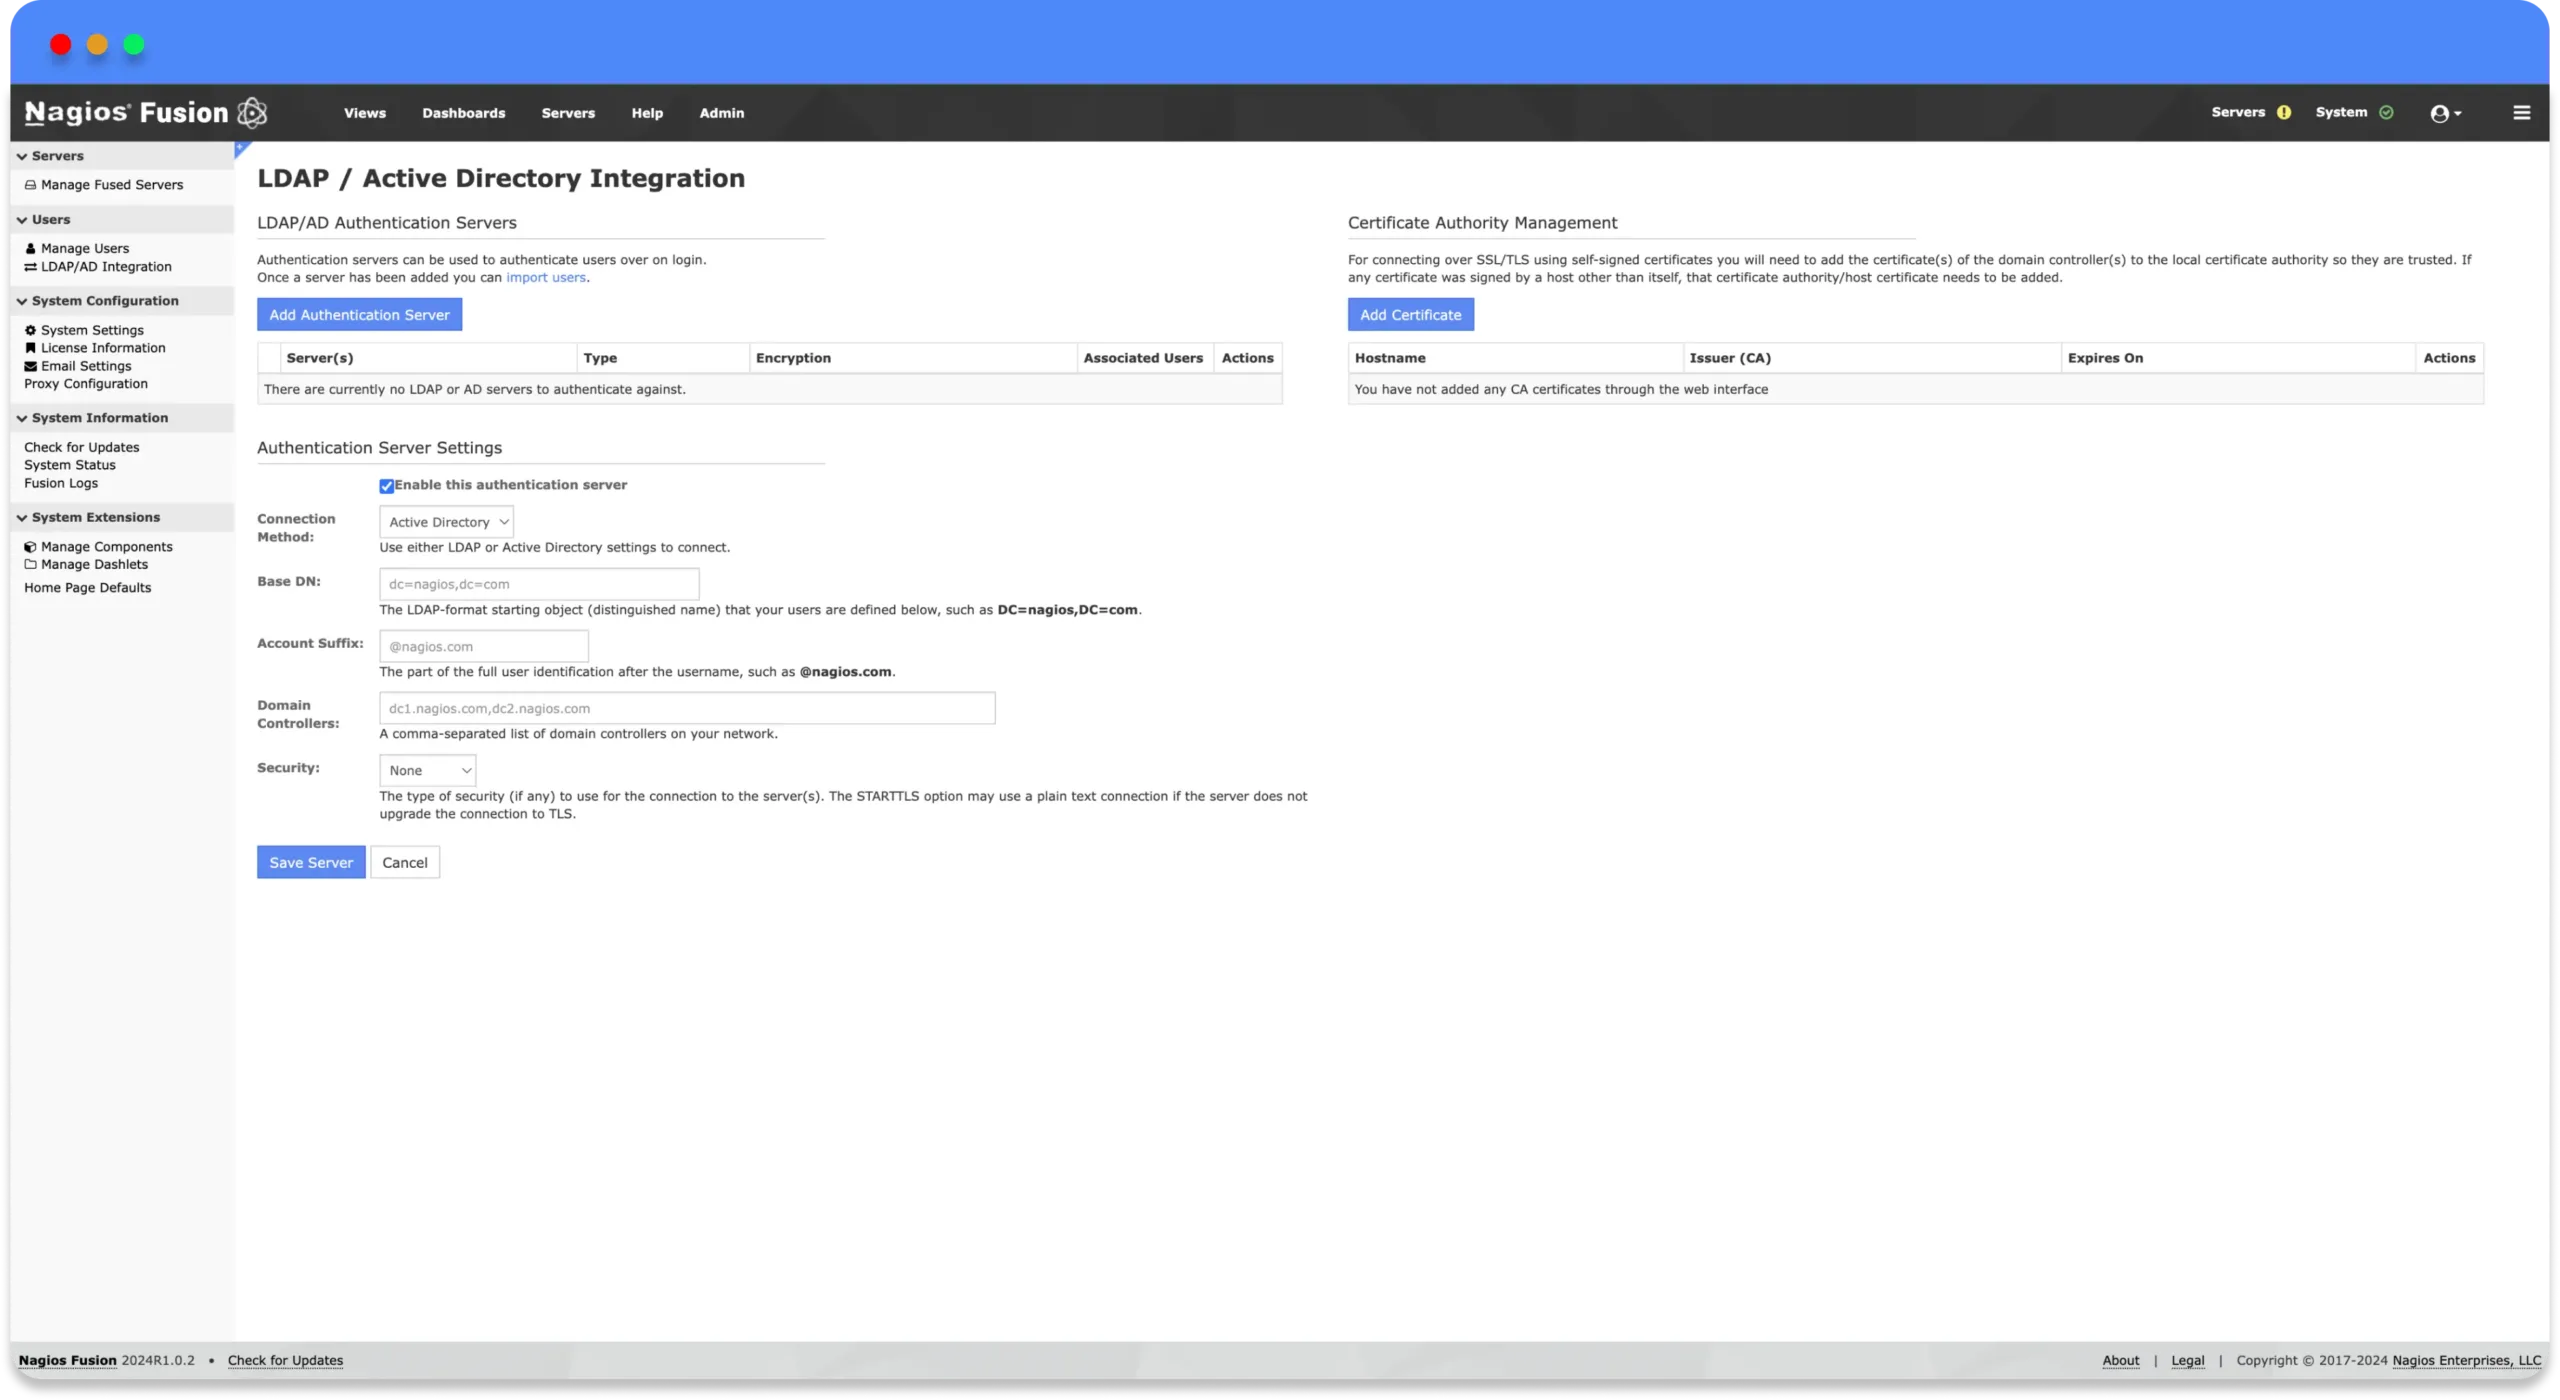
Users can submit their server credentials once and access all of their monitoring servers from within Fusion.
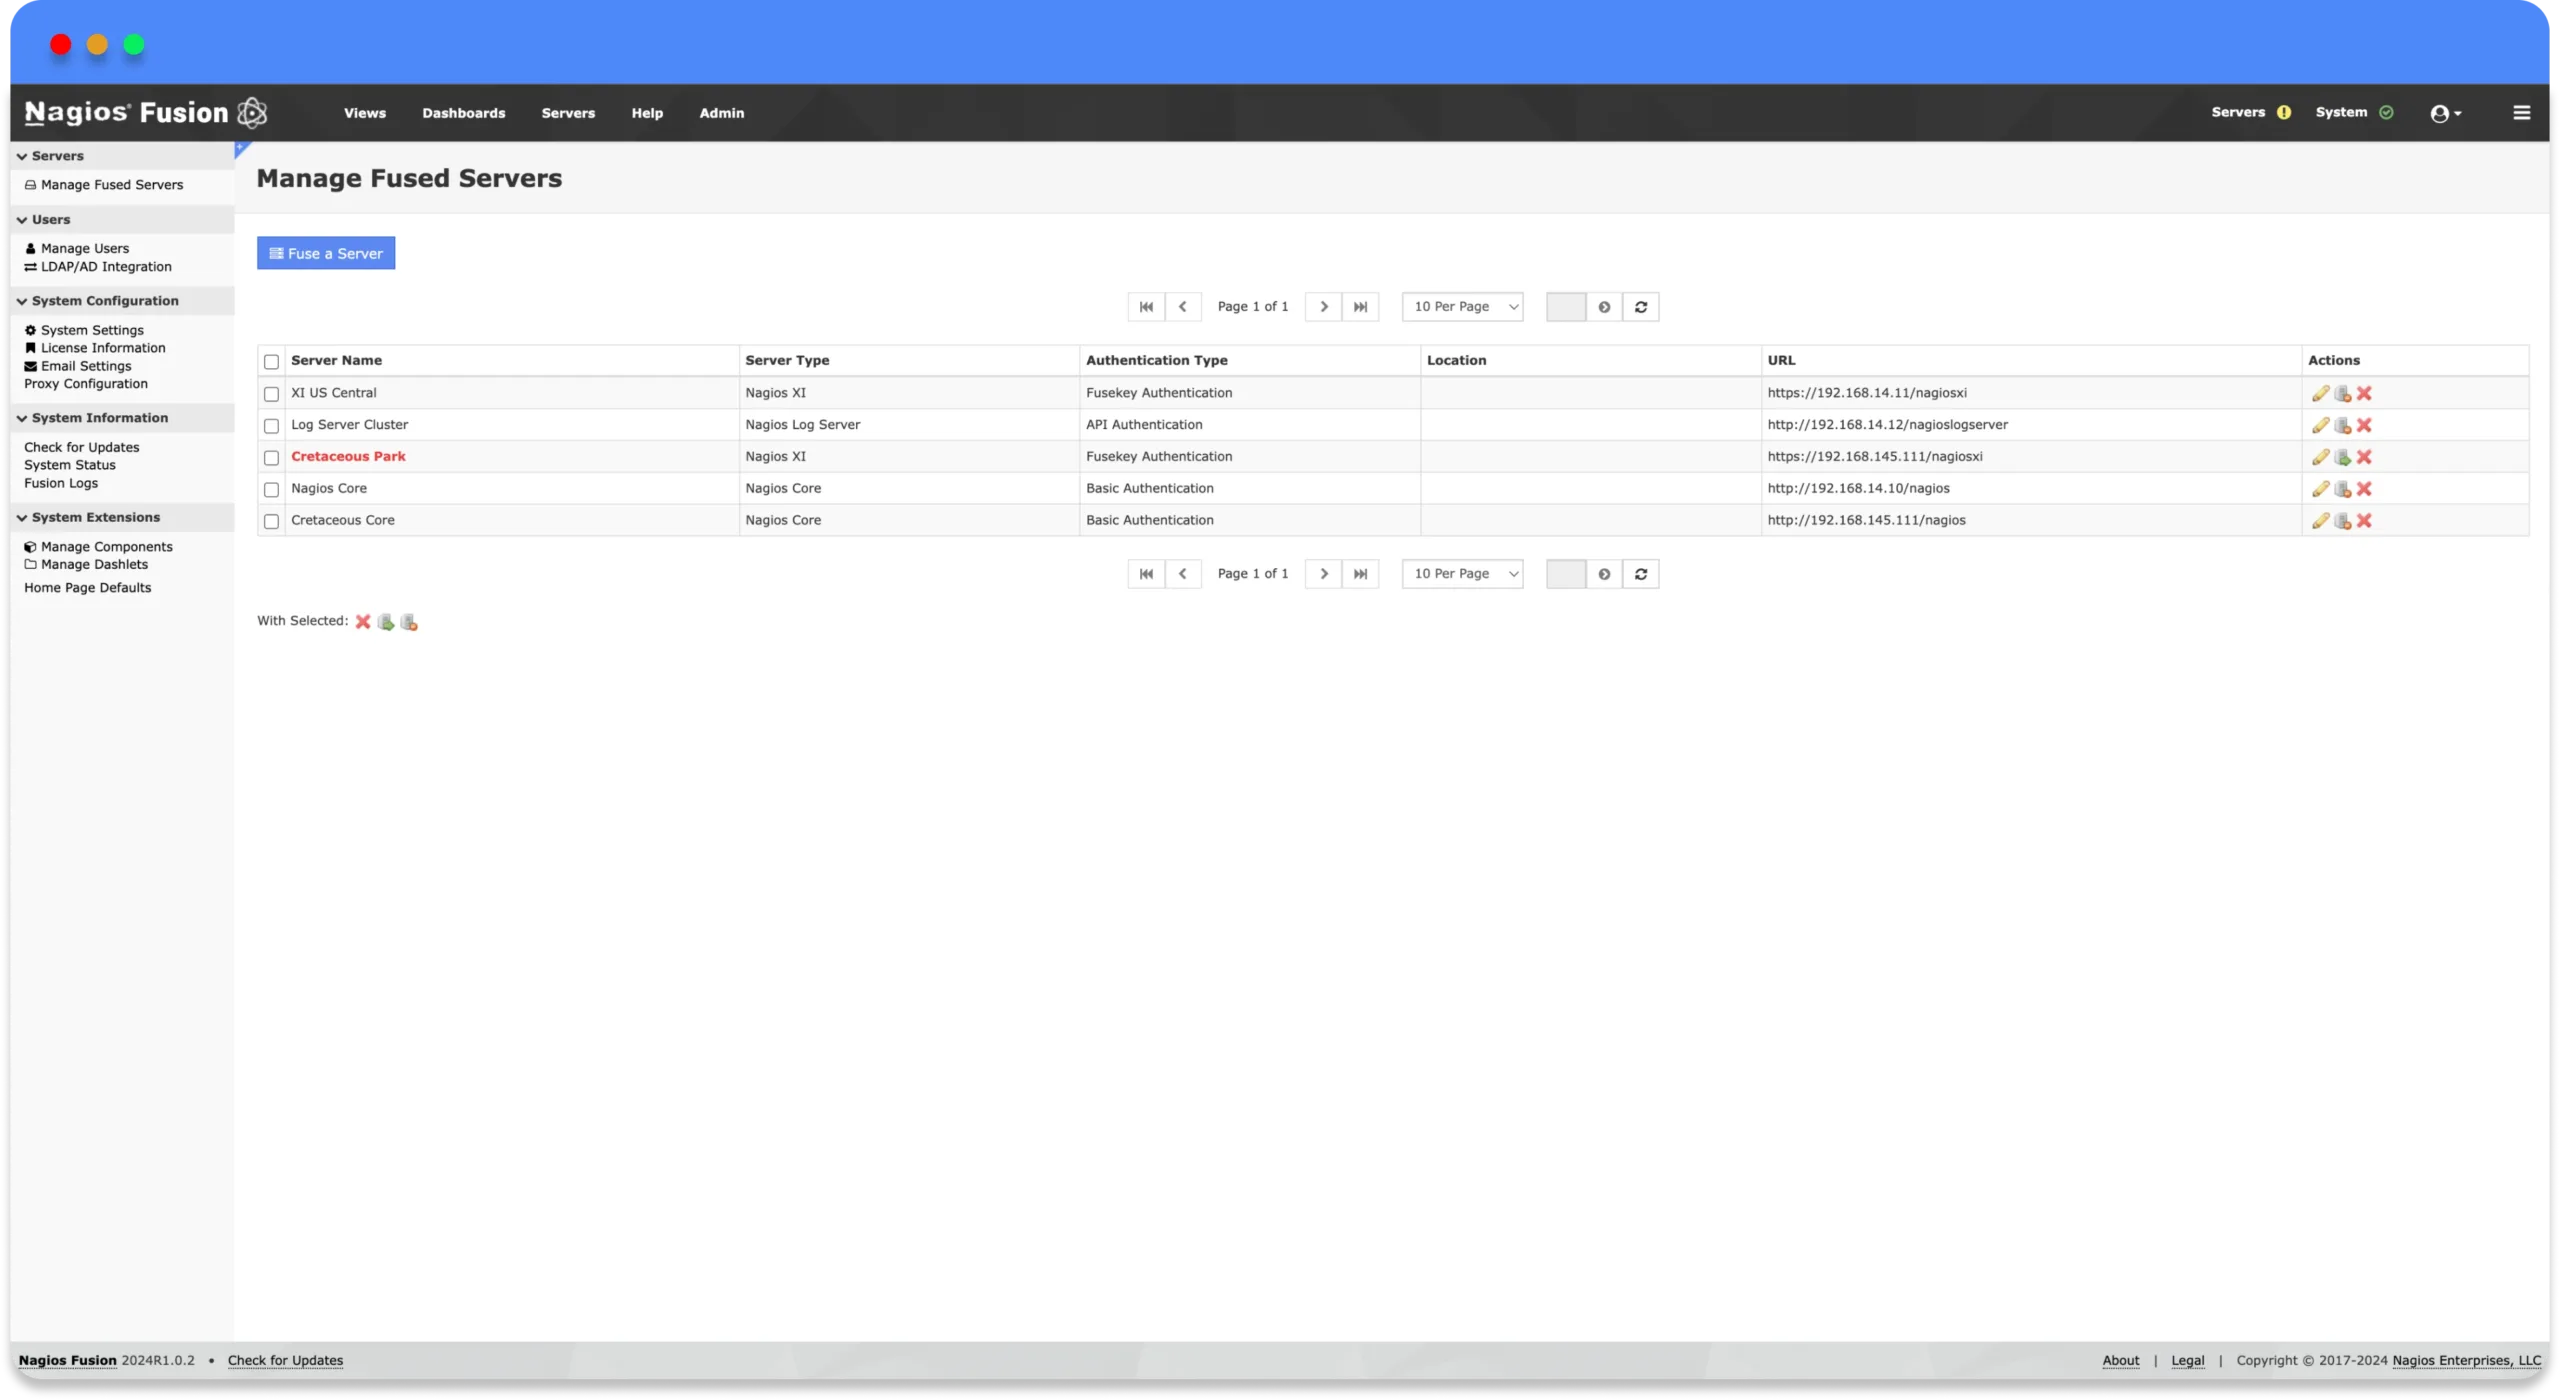
Users have quick access to XI servers while maintaining an overall view of network health.
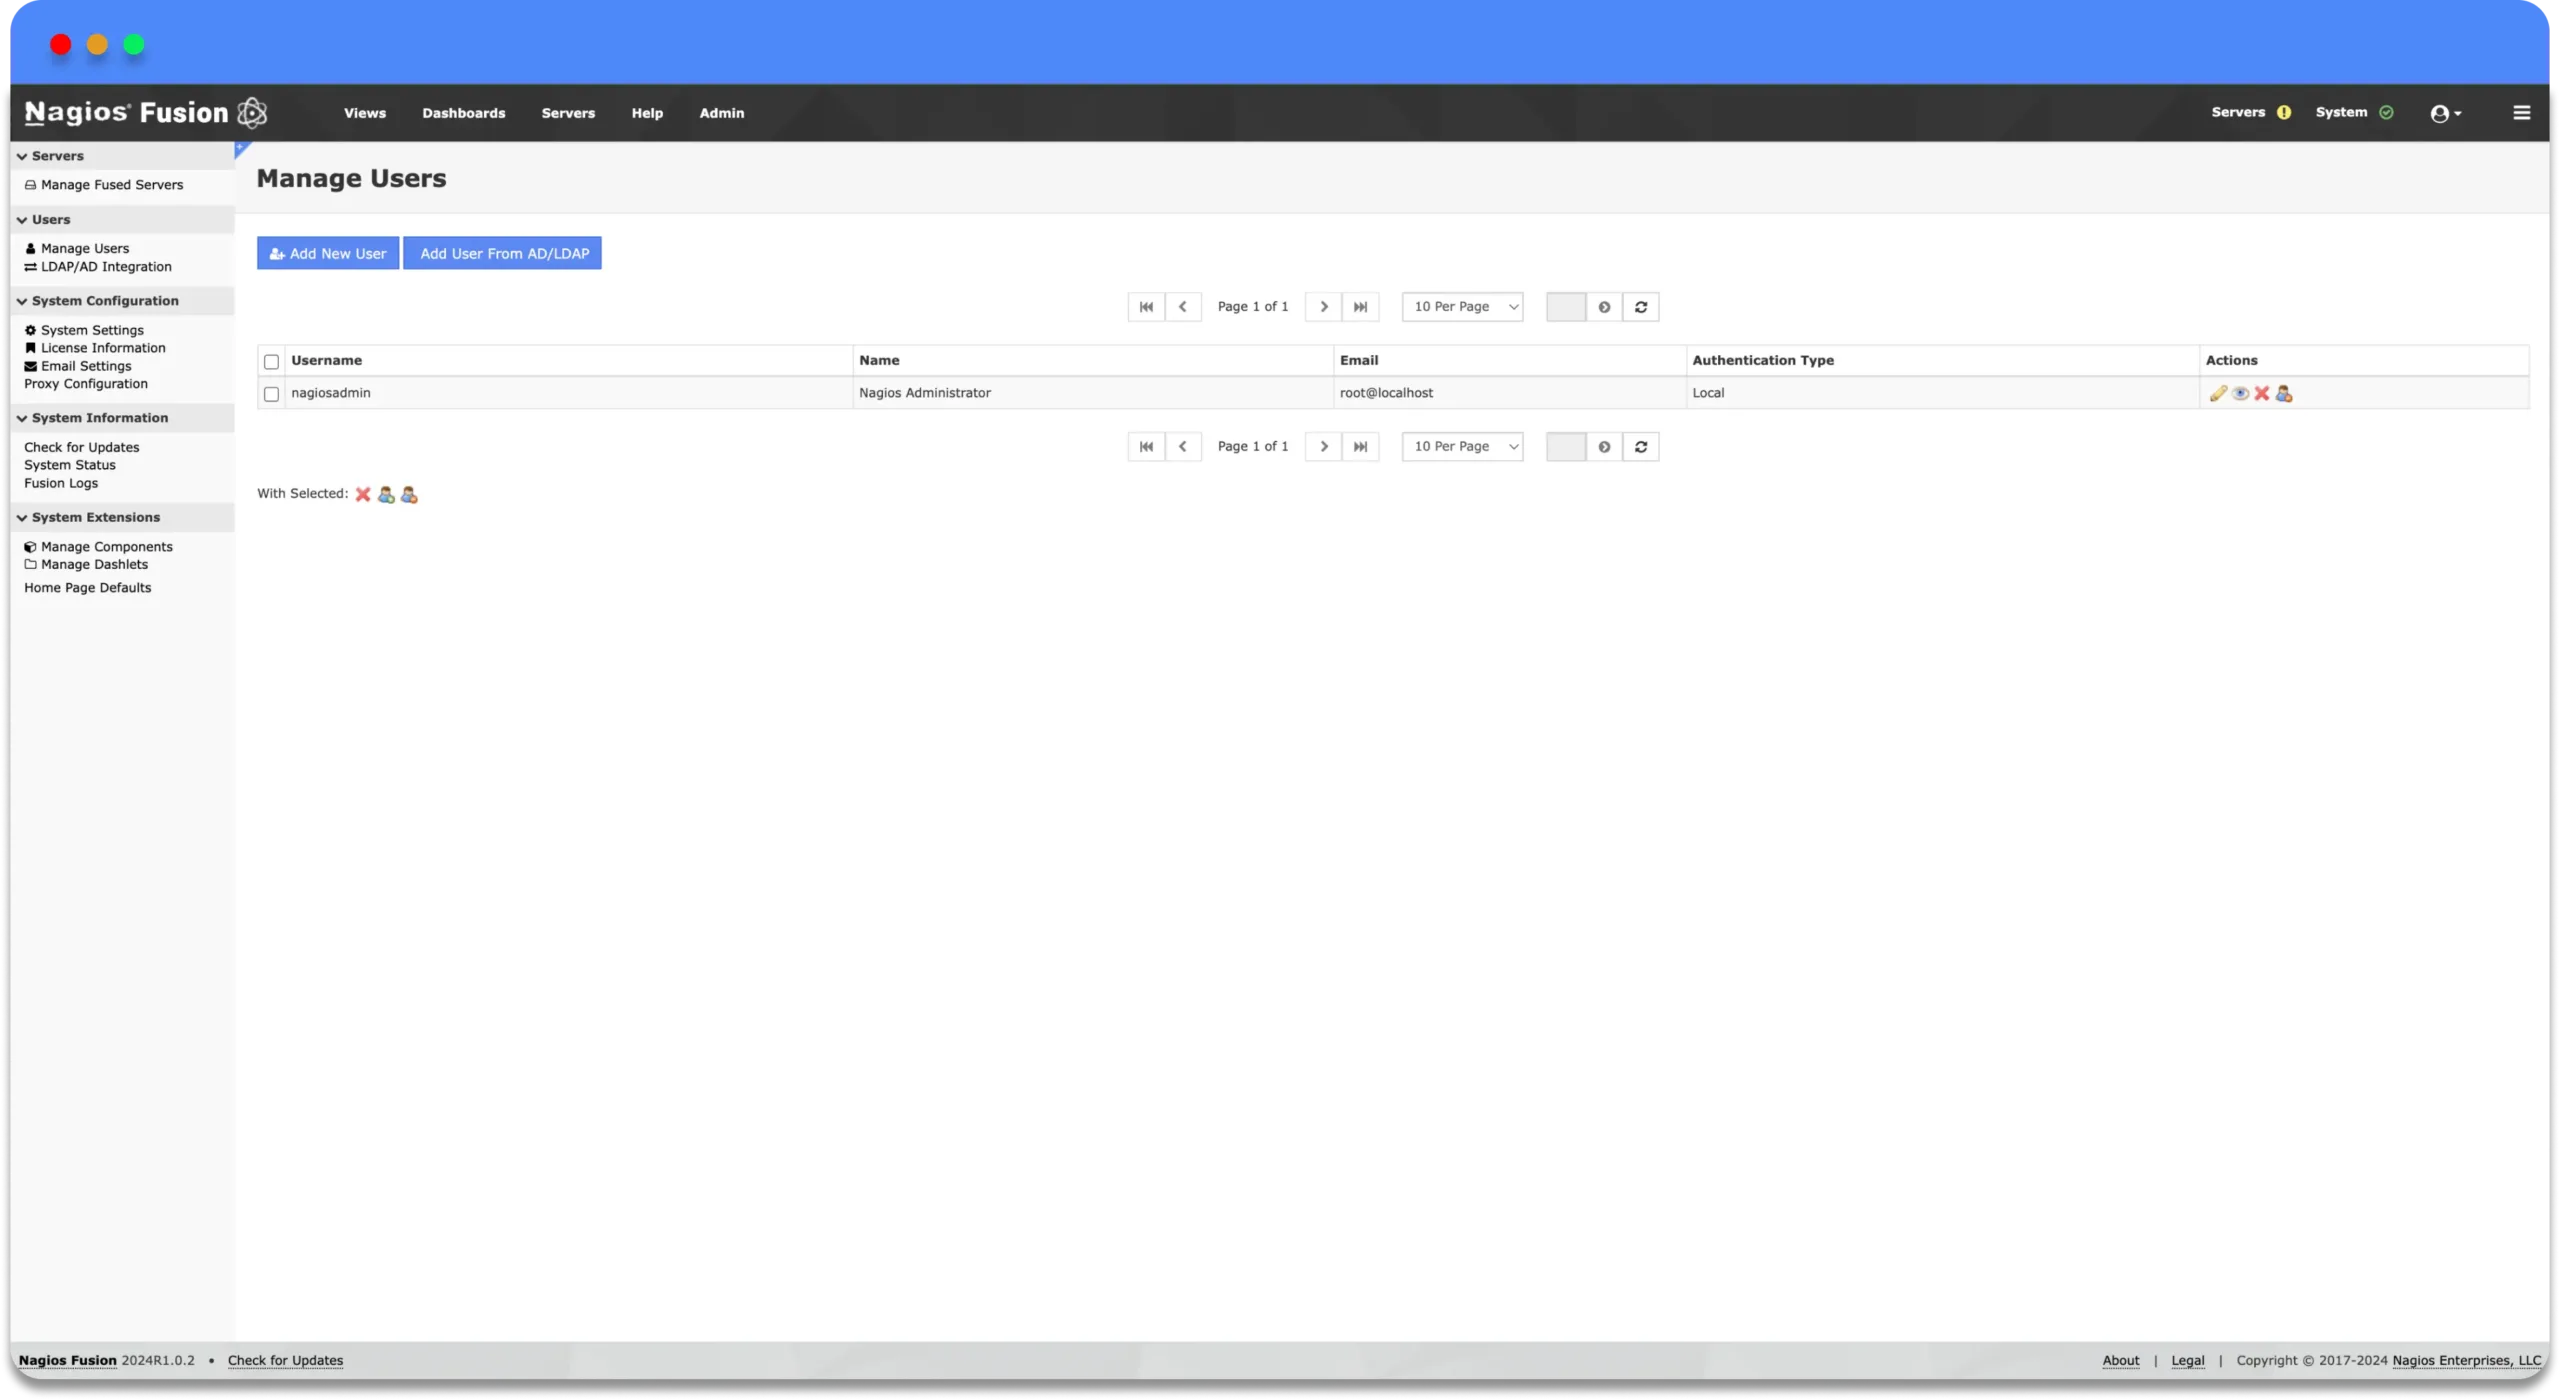
Multi-Tenancy capabilities allow IT teams to work together efficiently and keep the network running smoothly.
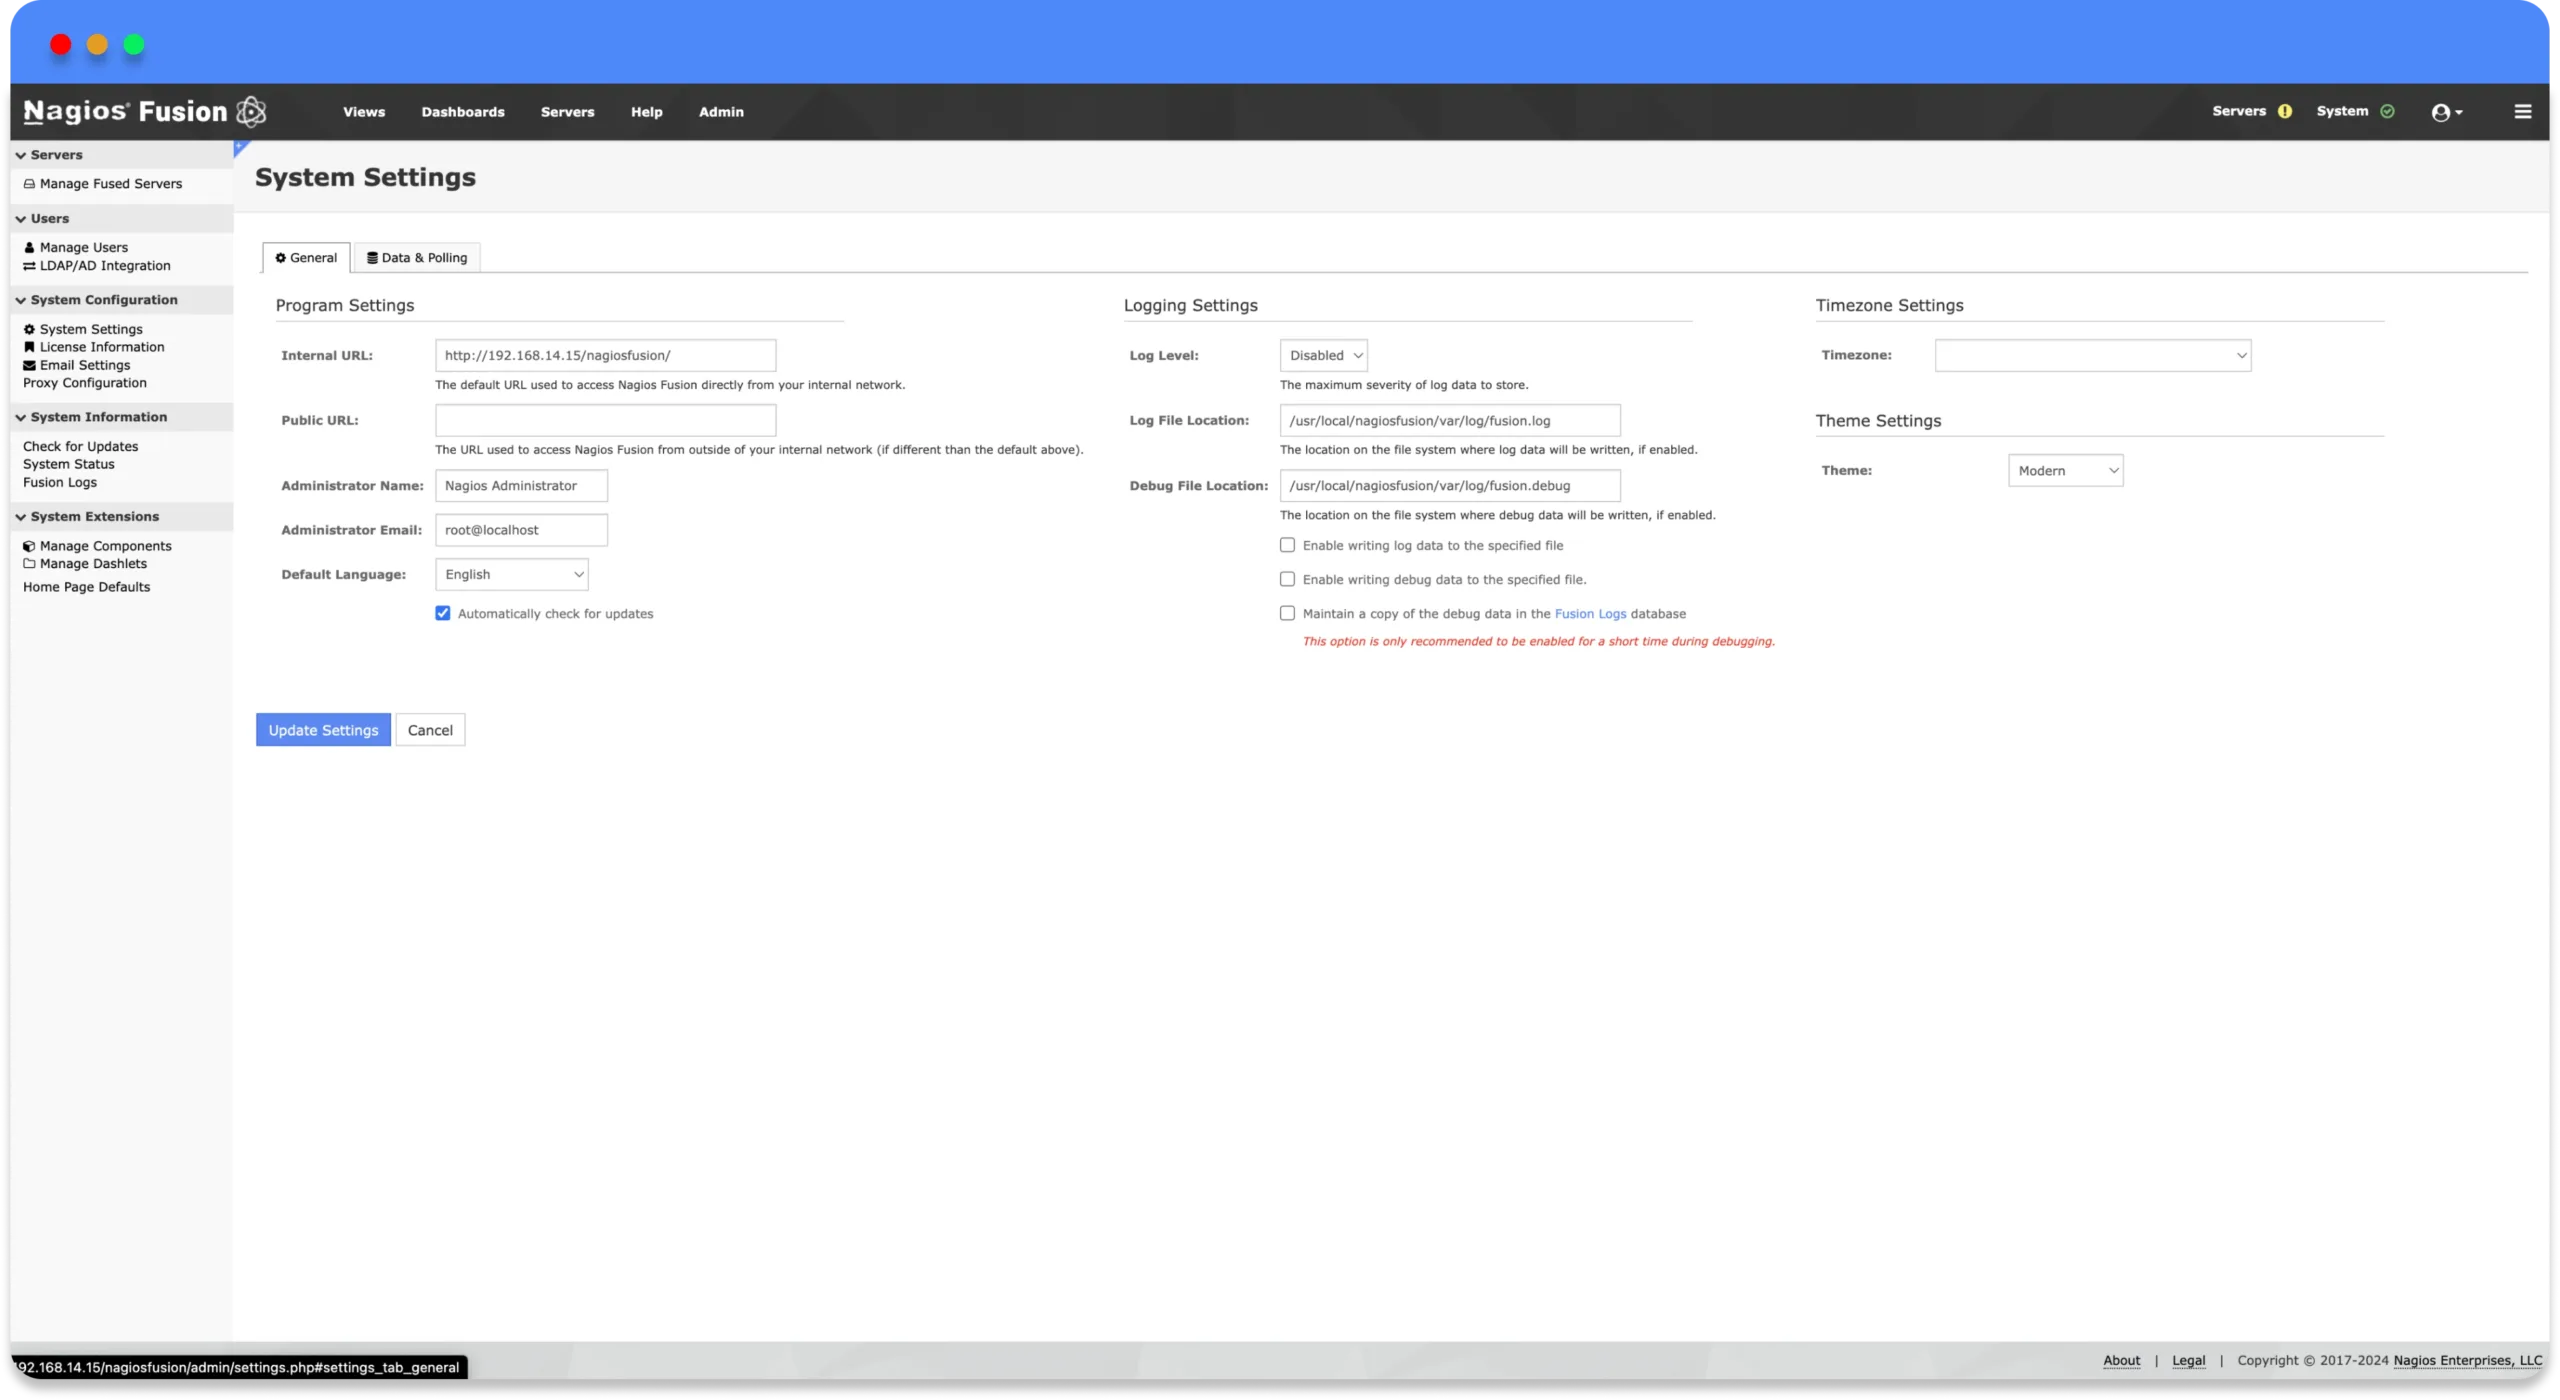
Have complete control over system settings, improving bandwidth utilization by allowing you to manage polling frequency.